2

Does anyone know of a source for an Arctic EPSG:4326 map projection?

I have some arctic ice data that I'd like to visualize with Tableau 8.0 which accepts external wms maps, so long as they're EPSG:4326 (Plate Carree) projections.

Such a projection tangent to the equator won't work for high latitudes but there's nothing that says you couldn't do a mercator-like projection using the prime meridan as the 'equator' so that close to the pole x-y placements would be reasonably accurate.

If such a thing existed I could upload it into Tableau 8.0 and plot my points. Or, if there was a recipe for reprojecting an existing map into this format using grass or gdwalp or some such I could do it myself.

6
  • Oh, I should have also said that I understand that the projection I propose is completely non-standard and that I'd have to also reproject the coordinates of my dataset into the new coordinate system to make it all work. But it's just math, right?
    – user203406
    Commented Oct 31, 2013 at 18:38
  • What is the ice data? Many products are delivered in a native polar stereographic projection (there's practically a standard for NSIDC/SSMI/AMSR-E, which is a rare happy bonus) that would be a better choice if that works for you. They tend not to be delivered with metadata included, but it's easy to find/apply. Are you just wanting to view the data or ultimately serve it up somehow? QGIS and R are good alternatives, but gdal ties it all together as usual.
    – mdsumner
    Commented Oct 31, 2013 at 22:58
  • The ice data is reported in drafts as measured by the first echo return of upward looking sonar from submarines. The data is a collection of sanitized tracks with a starting and ending lat/lon with ice draft data reported at intervals along the track. There's plenty of metadata provided and I'll have my work cut out for me in ingesting it all, but it looks complete. Mostly I'm just looking to view the data as opposed to serving it up. I didn't quite follow this comment:
    – user203406
    Commented Oct 31, 2013 at 23:54
  • > QGIS and R are good alternatives, but gdal ties it all together as usual.
    – user203406
    Commented Nov 1, 2013 at 0:00
  • Do you mean to use QGIS to reproject the NSIDC map data? Or as a replacement for Tableau? In either case how would that work?
    – user203406
    Commented Nov 1, 2013 at 0:03

3 Answers 3

4

It is basically possible to do what you want, but not the easy way.

I did the following with QGIS:

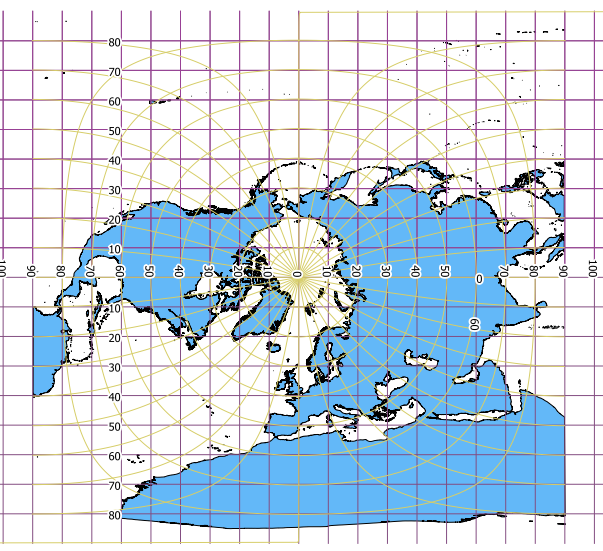
Restricting the manipulation to the northern hemisphere, I clipped the Natural Earth's land polygon and degree grid to positive values of latitude. Then I created a custom CRS for laea projection centered on the North Pole:

+proj=laea +lat_0=90 +lon_0=0 +x_0=0 +y_0=0 +ellps=GRS80 +towgs84=0,0,0,0,0,0,0 +units=m +no_defs

and reprojected the data to it.

In a second step, I created a similiar laea projection at 0°E/0°N:

+proj=laea +lat_0=0 +lon_0=0 +x_0=0 +y_0=0 +ellps=GRS80 +towgs84=0,0,0,0,0,0,0 +units=m +no_defs

and assigned it to the data from the last step. Note that I did not reproject the data to the new CRS in this step!

Then I reprojected that dataset back to WGS84, which puts the North pole into the middle of the Atlantic.

This is the picture I got:
enter image description here

I included the new degree grid in purple and the traditional grid in light green. The result is obviously useless around the equator, but should be usefull around the north pole.


EDIT

A very simple reprojection from Greenwich coordinates to North pole coordinates using a sphere would be:

En = (90°-Ng) * sin (Eg/180° * PI())
Nn = (Ng-90°) * cos (Eg/180° * PI())

With Eg and Ng degrees East and North in Greenwich coordinates (EPSG:4326) En and Nn degrees of a geographic Coordiante system centered at the north pole.

This will give you concentric circles for the Greenwich latitudes.

2

A Mercator projection that has a standard meridian, instead of the (standard) equator, is called a Transverse Mercator projection. A very commonly used set of such are Universal Transverse Mercator (UTM) projections. However, these are not often used in polar regions, as you require. For such purposes, the Universal Polar Stereographic (UPS) projection is used.

1
  • Yup, we'd prefer a UTM projection. But Tableau 8.0 won't accept one as input, that's why I'm trying to gin up a workaround. What I'm looking for is a Transverse Mercator Projection of the North Pole.
    – user203406
    Commented Nov 1, 2013 at 3:52
1

I think you're out of luck.

The UTM style, Plate Carree seem to be rectangular projections, with lat, lon stretched out, basically, onto a square map. Think about it, you have a set up numbers recording points along the top of the image, the rectangle like this: http://upload.wikimedia.org/wikipedia/commons/8/83/Equirectangular_projection_SW.jpg and you're hoping that the software will know that the points all along the top of that map are coincident. You are asking a user-friendly, simple bit of software to do something quite hard! I think you need to be looking into specialist software. R is good and free, but hard. A GIS like QGIS, or GRASS or ArcGIS for example will handle this flawlessly.

Here's some reading: http://www.geowebguru.com/articles/242-polar-maps-and-projections-part-1-overview

Your Answer

By clicking “Post Your Answer”, you agree to our terms of service and acknowledge you have read our privacy policy.

Not the answer you're looking for? Browse other questions tagged or ask your own question.