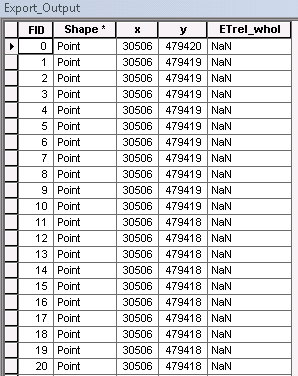
I've got an XY dataset that I'd like to convert to a raster, based on the ETrel_whol field. The ETrel_whole field includes NaNs and ranges from 0-1. I would like to convert this to a raster, with a color stretched from 0-1, and NaN mapped as no color. The columns of the input data are shown here:
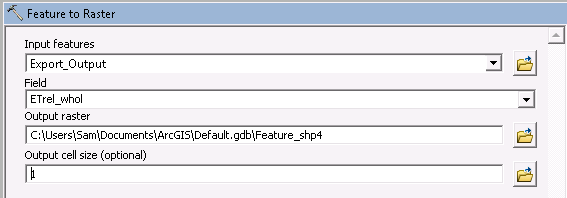
I convert to a raster using the Feature to Raster tool in the Conversion toolbox:
Note that I've also tried the Point to Raster, with the same outcome. It looks like ArcMap 10 assigns 102 "unique values" to the ETrel_whol field. 1 for NaN, and then one for each value from 0-1 at 0.01 intervals, based on my input data. The output attribute table is shown here:
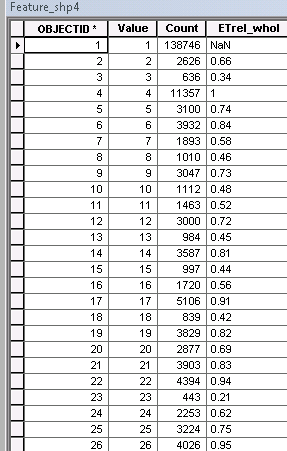
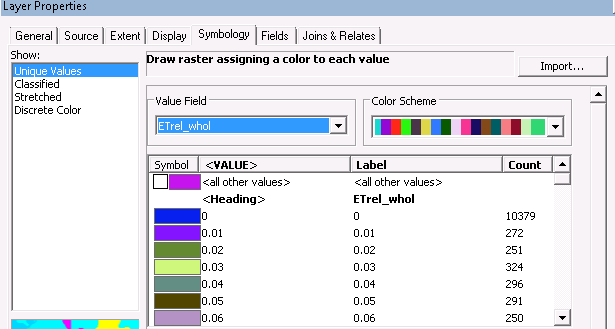
The issue is that the Value field appears to be assigned randomly to my ETrel_whol field, rather than sequentially, and the output raster has the colormap based on the Value field, rather than the ETrel_whol field. If I switch my Symbology to Unique Values, I can define that the value field should be ETrel_whol, and colors are assigned to each value from 0-1, as shown here:
However, if I want to set the symbology to Stretched, it does not give me a choice of the value field, and simply stretches the Values from 1-102, rather than ETrel_whol from 0-1, as shown here:
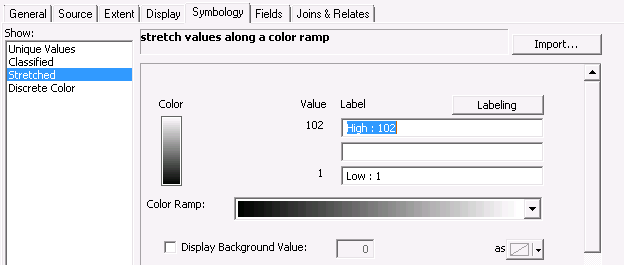
How can I map the colors of this raster to the ETrel_whol field, rather than the Value field?
Thanks for your help!
-sam
