0

I am using the following code to merged polygons from shapefiles for the purpose of calculating the surface area;

library(maptools)
library(rgdal)
library(rgeos)

#enter slots, e.g. area
shp_list[[3]]@polygons[[1]]@area

setwd("~/type1/speciesX1/")
# Select species
species <- 'speciesX1'
print(species)

# List shapefile-dirs for that species 
shp_dir <- list.files(path=species, pattern="*.shp", full.names = TRUE, recursive = TRUE,   include.dirs = FALSE)

# Read all the shapefiles and place them in a list
shp_list <- lapply(shp_dir, function(x) {readOGR(dsn=x, layer=ogrListLayers(x), verbose=T)})

# Check how many shapefiles have been loaded
number_of_loaded_shapefiles <- length(shp_list)
print(paste("Number of loaded shapefiles: ", number_of_loaded_shapefiles))

# Set the number of fields to 3, i.e. name, id, mrgid and set id and iso_3digit to id if present
set.seed(1234)
for(i in seq_along(shp_list)){
# EEZ
  if('objectid' %in% colnames(shp_list[[i]]@data)==T){
   shp_list[[i]]@data <- subset(shp_list[[i]]@data, select=-c(objectid, country, sovereign, remarks, sov_id, eez_id, iso_3digit, date_chang  ,area_m2, longitude ,latitude))
   shp_list[[i]]@data['id']<-paste0(shp_list[[i]]@data$id,shp_list[[i]]@data$iso_3digit)
   colnames(shp_list[[i]]@data)[colnames(shp_list[[i]]@data) == 'eez'] <- 'name'
  }else{
# IHO + EEZ (e.g. Mexican part of the North Pacific Ocean, 25569)
    if('iho_id' %in% colnames(shp_list[[i]]@data)==T){
     shp_list[[i]]@data<-subset(shp_list[[i]]@data, select=-c(objectid_1, iho_sea, iho_id, iho_mrgid, country, sovereign, sov_id, eez, eez_mrgid, longitude, latitude, area_m2))
     colnames(shp_list[[i]]@data)[colnames(shp_list[[i]]@data) == 'marregion'] <- 'name'
     colnames(shp_list[[i]]@data)[colnames(shp_list[[i]]@data) == 'eez_id'] <- 'id'
     shp_list[[i]]@data['id']<-paste0(shp_list[[i]]@data$id, paste0(sprintf("%1s", sample(LETTERS,1)),sprintf("%1s", sample(LETTERS,1))))
     shp_list[[i]]@data <- shp_list[[i]]@data[,c(1,3,2)]
    }else{
# MEOW (ecoregion, e.g. Bahamian 21980)
      if('eco_code' %in% colnames(shp_list[[i]]@data)==T){
       shp_list[[i]]@data<-subset(shp_list[[i]]@data, select=-c(lat, long, placetype))
       colnames(shp_list[[i]]@data)[colnames(shp_list[[i]]@data) == 'ecoregion'] <- 'name'
       colnames(shp_list[[i]]@data)[colnames(shp_list[[i]]@data) == 'eco_code'] <- 'id'
       shp_list[[i]]@data['id']<-paste0(shp_list[[i]]@data$id, paste0(sprintf("%1s", sample(LETTERS,1)),sprintf("%1s", sample(LETTERS,1))))
       shp_list[[i]]@data <- shp_list[[i]]@data[,c(2,1,3)]
    
      }
    }
  }
}

# See the row names (IDs)
lapply(shp_list, function(x) row.names(x@data))

# Generate unique id string on the fly
set.seed(1234)
shp_list <- lapply(shp_list, function(x) {
new.id <- paste0(x@data$id, sprintf("%03d", round(runif(1, 1, 999)),0))
spChFIDs(x, new.id)
})

# Print mrgids
for(i in seq_along(shp_list)){
  print(shp_list[[i]]@data$mrgid)
}

# Merge the SPDF 
merged_shp_list <- do.call("rbind", shp_list)

# Some of the polygons (areas) are the same in the two original SPDFs.
# Check the attribute data
attribute_data_in_merged_shp_list <- merged_shp_list@data

# E.g. Alboran sea (mrgid=3324) is present in both. Make a spatial union based on a common ID-value (mrgid)
union_polygons <- unionSpatialPolygons(merged_shp_list, IDs=merged_shp_list@data$mrgid)

# Check how many polygons are present in the original merge   
number_of_polygons_before_merge <- nrow(merged_shp_list)
print(paste('Number of polygons before merge: ', number_of_polygons_before_merge))

# How many polygons are present after merge
number_of_polygons_after_merge <- length(union_polygons)
print(paste('Number of polygons after merge: ', number_of_polygons_after_merge))

# unionSpatialPolygons returns a SpatialPolygons object, but we want to retain the original attribute data as well. Get only the unique rows from the original attribute data
attribute_data <- unique(merged_shp_list@data)

# Row names (IDs) need to match the IDs in union_polygons
rownames(attribute_data) <- attribute_data$mrgid

# Create a new SPDF
final_shp_list <- SpatialPolygonsDataFrame(Sr=union_polygons, data=attribute_data)

# Checks
number_of_merged_polygons_final <- nrow(final_shp_list)
print(paste('Number of merged polygons: ', number_of_merged_polygons_final))

# Calculate area
area <- gArea(SpatialPolygons(final_shp_list@polygons))
print(paste('Area (',species,')',':',area))

# Plot marged polygons
final_shp_plot <- spplot(final_shp_list, "mrgid", colorkey=F, fill='cyan')
print(final_shp_plot)

The shapefiles I'm using are from Marineregions.org

In some cases, the merged polygons might overlap, depending on what type of shapefile have been used (e.g. EEZ, IHO, MEOW). I want to calculate the surface area of the merged polygons, but figured that as it currently is the calculated area includes potential intersections, so I wonder how to unionize these from a set of merged polygons. I've looked into the rgeos package; gUnion, gIntersection, gDifference etc but these functions only works on a pair.

Below are links to two shapefiles (choose shapefile in the Download drop-menu). For the code, place the files in ~/type1/speciesX1/ and name e.g. the folders 1 and 2 and the files within correspondingly. Sorry, for this part.

Example Data

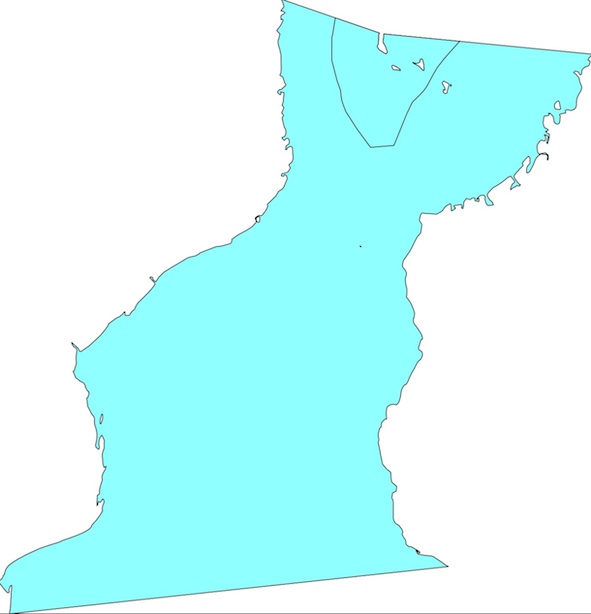
Comoran part of the Mozambique Channel is part of Mozambique Channel, thus we can see if the intersection is calculated twice for the merged polygon.

Output of Example Data

Plot of the merged polygons Plot of merged polygons
Test

area 
125.6221 (as its calculated from above code)

# Area of the two polygons
A1 <- gArea(SpatialPolygons(shp_list[[1]]@polygons))
A2 <- gArea(SpatialPolygons(shp_list[[2]]@polygons))

A1
6.807844
A2
118.8142

# Area of the union
u <- gUnion(shp_list[[1]], shp_list[[2]])
uA <- gArea(SpatialPolygons(u@polygons))

uA
118.8142

# Area of the intersection
i <- gIntersection(shp_list[[1]],shp_list[[2]])
iA <- gArea(SpatialPolygons(i@polygons))

iA
6.807844 (same as A1)

uA + iA
125.6221 (same as calculated by the above code)

So the area calculated by the code does in fact include the intersection twice, i.e. no union is created, since the unionSpatialPolygons function creates unions based on IDs.

Is there any function e.g. like gUnion (or how can I use gUnion?) for multiple (>2) spgeom objects, which I can use and add to my workflow after creating unions based on IDs?

2 Answers 2

1

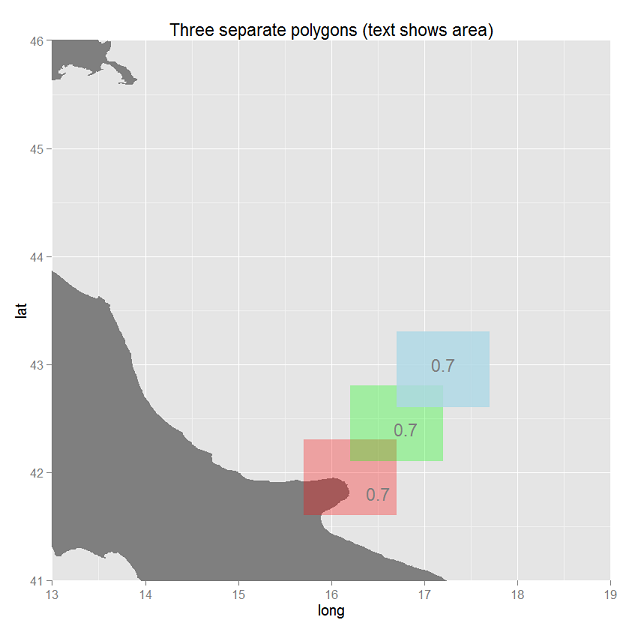
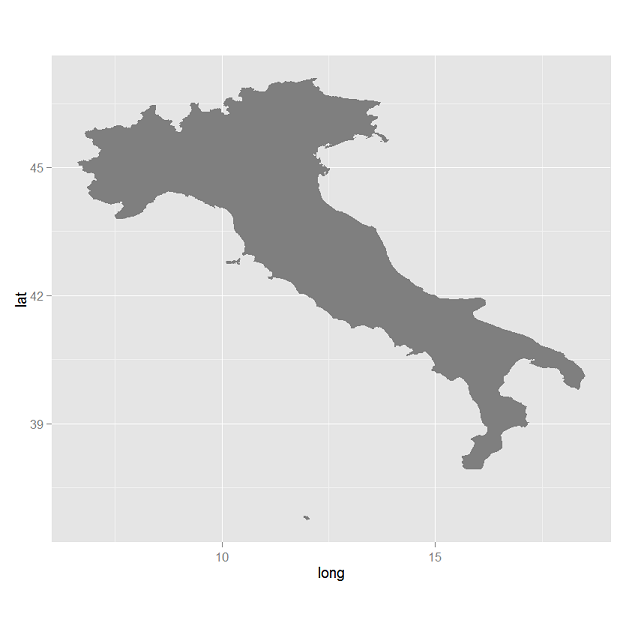
It is hard to say exactly what is going on because you have not supplied a minimal reproducible example. It looks as if providing a direct link to the shapefiles to download is difficult, so not your fault. Nevertheless, for complex issues like this your question will likely be ignored, as this was, if you don't give a MRE. That point aside, I would have thought that doing a union on the polygons would actually produce the right area without intersections. A generalised working using fake polygons seems to show the right sort of area. If you have a map like this:

italy

Then you can zoom in to one area in the Adriatic sea and instead of the polygons of your shapefiles you can superimpose the fake polygons you just created on it like this:

italypolygons

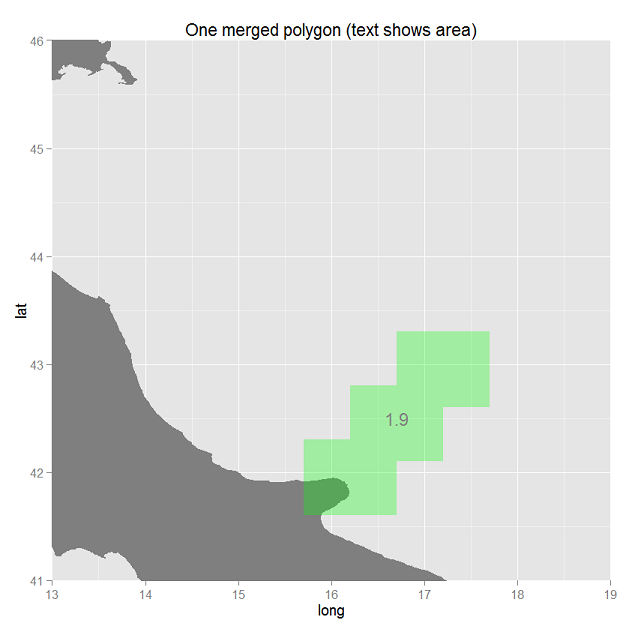
And then you can merge them into one and re-plot like this:

mergedpolygon

As you can, each polygon (three in the second plot, one in the third plot) has an annotation showing the area and these area values are consistent with what I would expect. The three individual polygons have an area of 0.7, the merged polygon - made of three polygons that were overlapping slightly - has an area of 1.9. Looks about right. Code is below. The area here is geometric, not real-world units. For that you need to experiment with spTransform() from the rgdal package.

require(sp)
require(ggplot2)
require(mapdata)
require(gridExtra)
require(scales)
require(rgeos)

# Load a world map
all <- map_data('worldHires')
# Subset to get Italy
italy <- all[which(grepl("italy",
                         all$region,
                         ignore.case = TRUE)), ]

# A quick test plot - looks okay
ggplot(data = italy, aes(x = long, y = lat, group = group)) +
    geom_polygon(fill = "grey50") +
    coord_equal() +
    theme(legend.position = "none")

# Create the coordinates for 3 squares
ls.coords <- list()
ls.coords[[1]] <- c(15.7, 42.3, # a list of coordinates
                    16.7, 42.3,
                    16.7, 41.6,
                    15.7, 41.6,
                    15.7, 42.3)

ls.coords[[2]] <- ls.coords[[1]]+0.5 # use simple offset
ls.coords[[3]] <- ls.coords[[2]]+0.5

# Prepare lists to receive the sp objects and data frames
ls.polys <- list()
ls.sp.polys <- list()

for (ii in seq_along(ls.coords)) {
    crs.args <- "+proj=longlat +datum=WGS84 +no_defs +ellps=WGS84 +towgs84=0,0,0"
    my.rows <- length(ls.coords[[ii]])/2
    # create matrix of pairs
    my.coords <- matrix(ls.coords[[ii]],
                        nrow = my.rows,
                        ncol = 2,
                        byrow = TRUE)
    # now build sp objects from scratch...
    poly = Polygon(my.coords)
    # layer by layer...
    polys = Polygons(list(poly),1)
    spolys = SpatialPolygons(list(polys))
    # projection is important
    proj4string(spolys) <- crs.args
    # Now save sp objects for later use
    ls.sp.polys[[ii]] <- spolys
    # Then create data frames for ggplot()
    poly.df <- fortify(spolys)
    poly.df$id <- ii
    ls.polys[[ii]] <- poly.df
}

# Create a data frame to hold the text
text.df <- data.frame(my.text = sapply(1:3, function(x) {
    round(ls.sp.polys[[x]]@polygons[[1]]@area, 3)}),
                      group = 1, # need this for ggplot
                      long = c(16.5, 16.8, 17.2),
                      lat = c(41.8, 42.4, 43.0))

# Plot polygons in different colours
ggplot(data = italy,
       aes(x = long,
           y = lat,
           group = group)) +
    geom_polygon(fill = "grey50") +
    # constrain the scale to 'zoom in'
    coord_cartesian(xlim = c(13, 19), ylim = c(41, 46)) +
    geom_polygon(data = ls.polys[[1]],
                 aes(x = long,
                     y = lat,
                     group = group),
                 fill = alpha("red", 0.3)) +
    geom_polygon(data = ls.polys[[2]],
                 aes(x = long,
                     y = lat,
                     group = group),
                 fill = alpha("green", 0.3)) +
    geom_polygon(data = ls.polys[[3]],
                 aes(x = long,
                     y = lat,
                     group = group),
                 fill = alpha("lightblue", 0.8)) +
    geom_text(data = text.df,
              aes(x = long, y = lat, label = my.text),
              size = 5,
              colour = "grey50") +
    ggtitle("Three separate polygons (text shows area)") +
    #coord_equal() +
    theme(legend.position = "none")

# Merge the three sp objects, in two steps
newpoly <- gUnion(ls.sp.polys[[1]],
                  ls.sp.polys[[2]])

newpoly <- gUnion(newpoly,
                  ls.sp.polys[[3]])


# Edit the text for the merged polygon
text.df <- text.df[1, ]
text.df$my.text <- round(newpoly@polygons[[1]]@area, 2)
text.df$long <- 16.7
text.df$lat <- 42.5

# Now plot with merged polygon
ggplot(data = italy,
       aes(x = long,
           y = lat,
           group = group)) +
    geom_polygon(fill = "grey50") +
    # constrain the scale to 'zoom in'
    coord_cartesian(xlim = c(13, 19), ylim = c(41, 46)) +
    geom_polygon(data = newpoly,
                 aes(x = long,
                     y = lat,
                     group = group),
                 fill = alpha("green", 0.3)) +
    geom_text(data = text.df,
              aes(x = long, y = lat, label = my.text),
              size = 5,
              colour = "grey50") +
    ggtitle("One merged polygon (text shows area)") +
    #coord_equal() +
    theme(legend.position = "none")
4
  • Thanks for your reply and insight. I thought the unionSpatialPolygons function only created a union based on IDs, thus if shapefiles are of different types (eez, iho, meow) they would not share these and no union would be created. Regarding the question per se, I don't know what more I should provide. I provided everything I use. The code (except for calculating the Area I see now), links to 3 example shapefiles (I specify choose shapefile in drop-down menu) and where to put them for the code to work. What else?
    – jO.
    Commented Jan 7, 2014 at 10:52
  • Well, it would be kinder to put your code in the question, rather than on GitHub. On the shapefiles, my point is that there is no unambiguous link to the shapefiles, just a page on which there is a further menu or a "download" link that just takes you to another page. However, having taken another look the Marine Regions site again, it does seem difficult to get a direct link. Perhaps better in such circumstances to mock up some fake data as above. I find that when I get stuck in GIS, creating my own sp objects from scratch often shows me the way. Commented Jan 7, 2014 at 11:01
  • Re gUnion, try it with your data and see. It's the only way. Commented Jan 7, 2014 at 11:10
  • SlowLearner: Tried to update question accordingly and included test of 'hypothesis' and it looks like we came to different conclusions
    – jO.
    Commented Jan 8, 2014 at 15:09
0

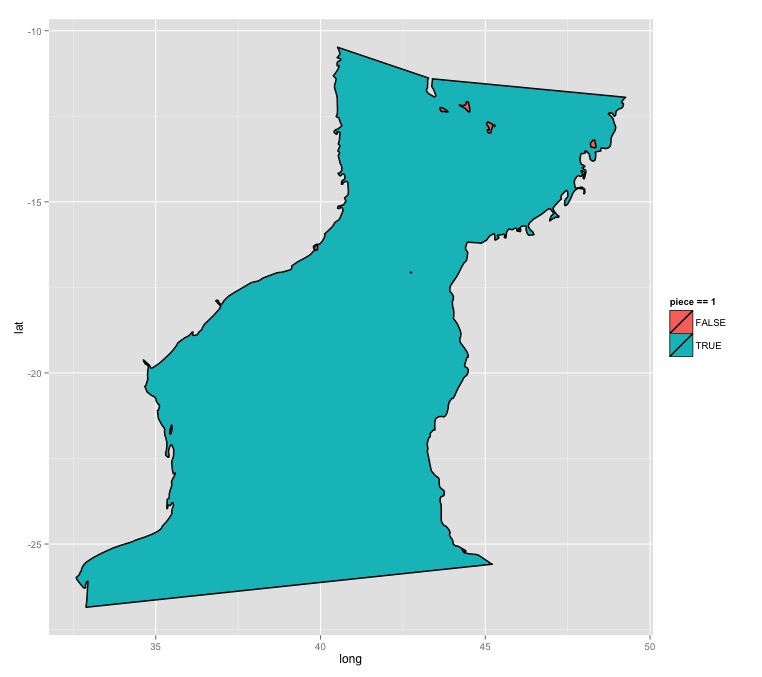
A very quick and dirty solution could be like this;

## Continuation of the above code from after line 95
# Make union of potential intersections so these are not included twice when calculating the area
union_intersections <- gUnaryUnion(union_polygons, id=NULL)

# Dataframe for ggplot, use fortify()
mydf <- fortify(union_intersections, region=NULL)

ggplot(mydf, aes(x = long, y = lat, group = piece)) +
 geom_polygon(colour = "black", size = 0.7, aes(fill=piece==1))

gArea(SpatialPolygons(final_merged_list@polygons))
 118.8142     ## A2 118.8142 (from above)

enter image description here

Your Answer

By clicking “Post Your Answer”, you agree to our terms of service and acknowledge you have read our privacy policy.

Not the answer you're looking for? Browse other questions tagged or ask your own question.