2

I have a satellite image (LandSat 5), I want create a raster with X,Y coordinates, this is possible in Model Builder of ArcGis 10.0? or other option. I know that the option $$YMAP ($$XMAP) not work more in ArcGis 10.0

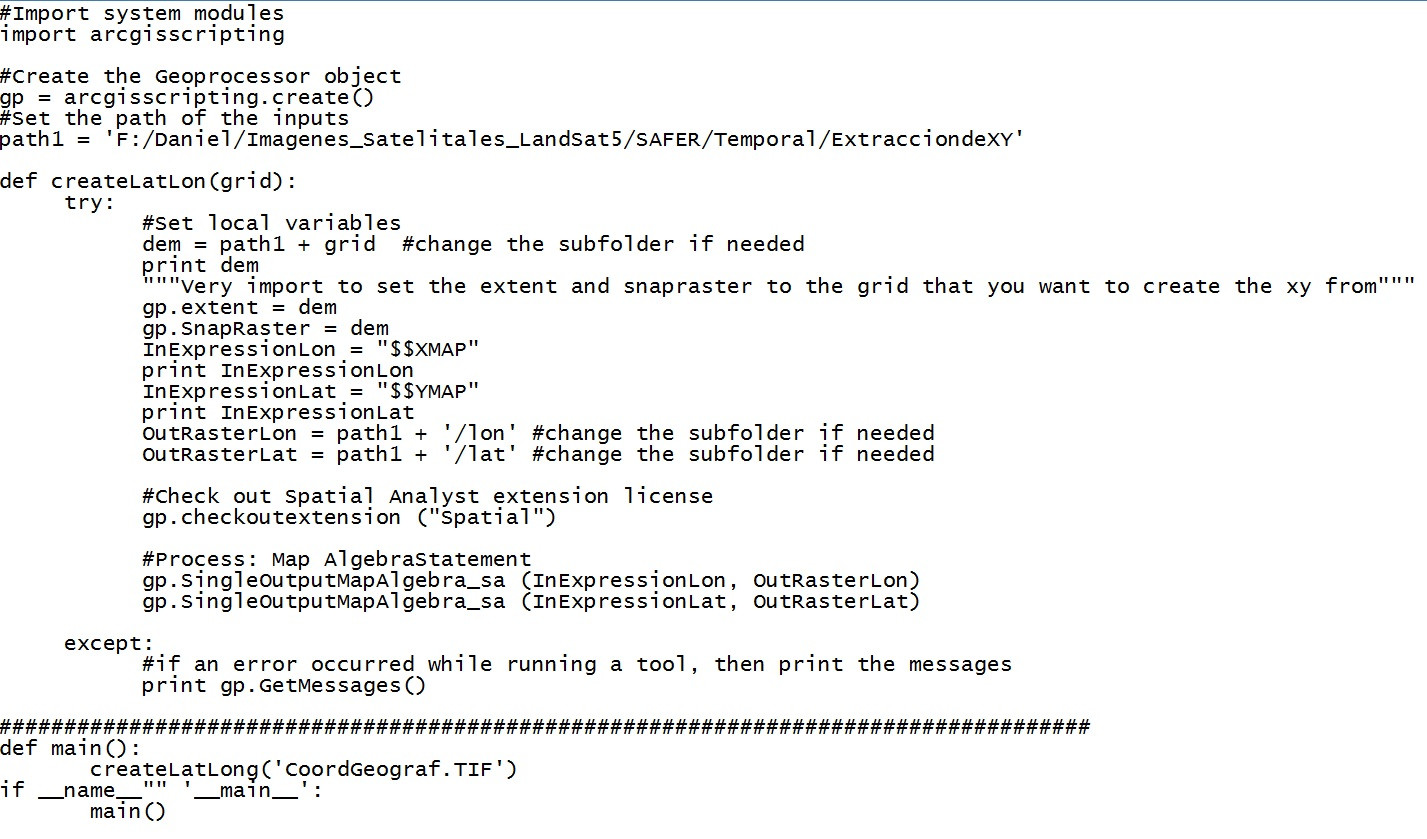
I want make the same. But my input is a raster (landsat image, UTM projection), I need obtain (output) a grid of latitude and a grid of longitude (two grids: latitude and longitude). First, this code is valid, and if, is possible work with ModelBuilder. I'm novel in arcgis and python, I working with evapotranspiration and I need this grids for calculate it. This is the code of video (www.youtube.com/watch?v=_-6apNB18gk):

enter image description here

2
  • 2
    I think there is a bit of confusion in your terminology. A LandSat image, IS a raster image. Each pixel in the raster represents a return value from the ground, located with an x and y coordinate. What is your project? Having a bit more detail about what you intend to do with the raster, may help figure out the operation you actually want to perform. Commented Mar 25, 2014 at 1:29
  • I assume the OP wants to convert the image to an ASCII raster in XYZ format. Commented Mar 25, 2014 at 8:08

3 Answers 3

4

There is a detailed discussion about this here :http://forums.arcgis.com/threads/3644-Generate-a-grid-of-latitude-values. William Huber & Curtis Price have offered a solution which involves using the FlowAccumulation tool in ArcMap. I haven't tried it but looks straightforward to me. Curtis Price has also posted some suggestions here : http://forums.arcgis.com/threads/865-beta-10-quot-built-in-quot-rasters-in-python-map-algebra. You have to modify the code to generate lat, long grid for your data ,i.e use the lower left corners of your imagery as the starting value of the array and then increase it by the cell size (30 m ~0.0001 degrees) in X and Y direction to get long and lat values and then convert it into a grid. Your array size will be the number of rows and columns of your imagery. You can write a generic code to produce a lat,long grid as a function (cellsize, nrow, ncols, LX, LY).

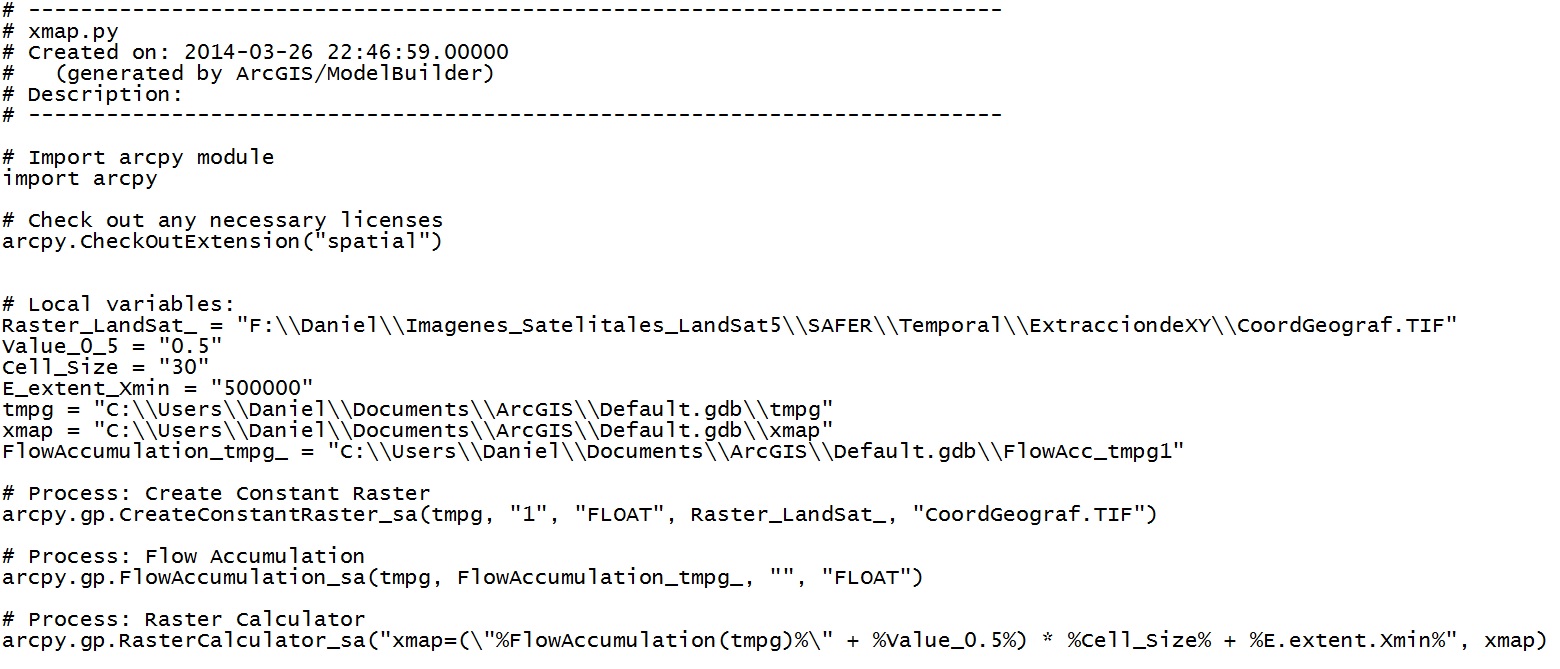
The code that I made is ok? I export the code of modelbuilder: enter image description here enter image description here

3

I assume you are wanting an output along the lines of the ASCII gridded XYZ format (or variation on this theme).

There are a few simple approaches to this depending on what licence and modules you have. What I would not do, though, is manually iterate over the raster to generate your XYZ file. You could do that but it will take time to write and debug and will most likely be slower than calling 'pre-coded' modules (which will be calling compiled code under the hood even from Python).

The first approach would be to convert the data to an XYZ ascii format. Here you have a whole heap of methods depending on taste:

  • If you have 3D Analyst you could use Feature Class Z to ASCII from the Convert Toolbox.
  • Use Raster to Point (Conversion) to convert your raster to points, add the X, Y columns to the attribute table and save the attribute table as a CSV (crude, but simple and effective!) making it either a headerless variant or not depending on your needs.
  • Install GDAL and call GDAL_Translate from within a Python script. GDAL offers a couple of options that will give the data in an XYZ ASCII raster format - check the documentation for the flavour you prefer.
  • This is not an exhaustive list of methods - there are others - it's just a few ideas of how you could do it in with tools usually readily available!

Secondly, you could sample your raster, this is pretty much what I think you wanted to do but I'd not bother writing my own script unless I had to. Instead, if you have Spatial Analyst, then use the Sample toolbox to create an XYZ table (I think it effectively comes out as ZXY but you can add a couple of steps to your process to reorder the columns). Save the output table as a CSV.

I've really just scratched the surface because you don't even need ArcGIS to do this. If you have GDAL and SciPy (both free) you can create a very fast approach of sampling the raster if you must roll-your-own method. I'd maybe use GDAL to read the raster to an array (in one go) and then write the array to a text file prepending the X and Y columns as you go (if you know raster origin then you can calculate the center of each cell as an offset). You can do this in Python.

Hopefully, this has given you a few ideas.
3
  • I want do this: youtube.com/watch?v=_-6apNB18gk but I have raster (landsat image) and not a DEM. This is possible in ModelBuilder? or python. I try run in python, but I haven't positive results. Commented Mar 26, 2014 at 3:11
  • The video is useless as it is such poor quality that I cannot see what is being done or read the code. It also has no audio. If you are not wanting to create an ASCII XYZ grid as described in my answer then I don't know how to help you. Please edit your question to provide more details and you may get the question reopened. Commented Mar 26, 2014 at 7:44
  • I put the code in the principal question. Thank you (Obrigado) Commented Mar 26, 2014 at 17:29
1

This is now trivial to do with GRASS tools available within QGIS. Open your raster data in QGIS (e.g., 'raster_dem.tif') and open the GRASS tool r.rastercalculator in the Processing Toolbox. For the formula variable, enter this:

raster_dem = y()

This will produce a raster of latitude values. If you also need a raster of longitude values, simply use x() instead of y(). It's much faster than previous methods too.

Creating Latitude Grid from DEM

Your Answer

By clicking “Post Your Answer”, you agree to our terms of service and acknowledge you have read our privacy policy.

Not the answer you're looking for? Browse other questions tagged or ask your own question.