8

I want to make a plot like that using R:
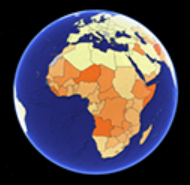
orthographic projection

All I want is the country borders as seen from outer space, no fancy colors needed. It seems I need to use the spTransform function, but it gives me a "non finite transformation detected" error. I've been told that I need to apply a cosine formula to each point in my world shapefile, and erase those that goes behind the Earth. This has 2 problems:

  1. It looks like something the algorithm should do automatically;
  2. I cannot just erase the points behind the Earth, cause this would destroy the topology of the polygons.

Isn't it a simple task? How should I do it?

EDIT - What I've done so far:

The shapefile was downloaded from here to a folder named "shp". The R code is just:

library(rgdal)
countries <- readOGR("shp","TM_WORLD_BORDERS-0.3",encoding="UTF-8",stringsAsFactors=F)
countries <- spTransform(countries,CRS("+proj=ortho +lat_0=-10 +lon_0=-60"))

It gives me the error

non finite transformation detected:
[1] 45.08332 39.76804      Inf      Inf
Erro em .spTransform_Polygon(input[[i]], to_args = to_args, from_args = from_args,  : 
  failure in Polygons 3 Polygon 1 points 1
Além disso: Mensagens de aviso perdidas:
In .spTransform_Polygon(input[[i]], to_args = to_args, from_args = from_args,  :
  108 projected point(s) not finite
1
  • Please provide a reproducible example as you did in your previous (and deleted) question.
    – user32309
    Commented Oct 2, 2014 at 1:14

2 Answers 2

6

Simple solution using the 'sf' package

library(sf)
library(ggplot2)
library(mapview)
library(lwgeom)
library(rnaturalearth)

# world data
world <- rnaturalearth::ne_countries(scale = 'small', returnclass = 'sf')

# Fix polygons so they don't get cut in ortho projection
world  <- st_cast(world, 'MULTILINESTRING') %>%
  st_cast('LINESTRING', do_split=TRUE) %>%
  mutate(npts = npts(geometry, by_feature = TRUE)) %>%
  st_cast('POLYGON')

# map
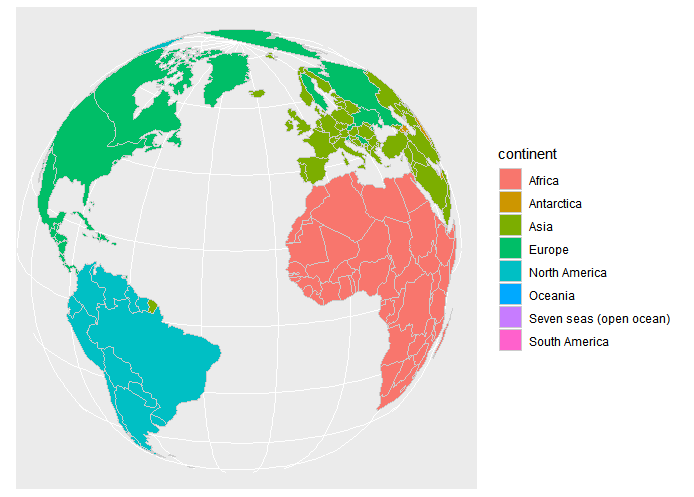
ggplot() +
  geom_sf(data=world, color="gray80", aes(fill=continent)) +
  coord_sf( crs= "+proj=ortho +lat_0=20 +lon_0=-10")  

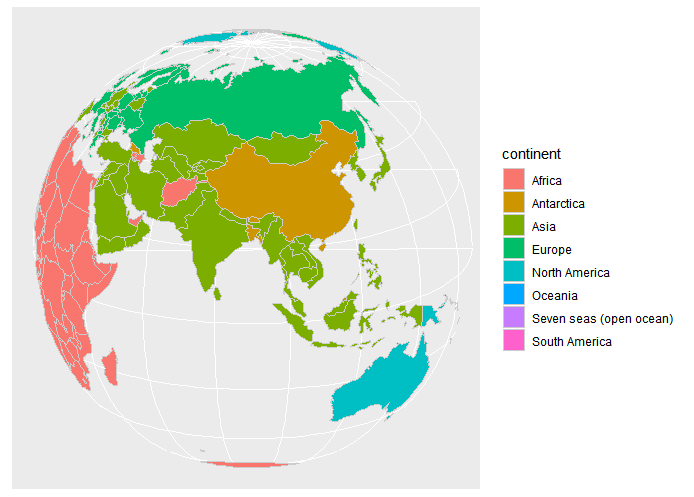
ggplot() +
  geom_sf(data=world, color="gray80", aes(fill=continent)) +
  coord_sf( crs= "+proj=ortho +lat_0=20 +lon_0=90")  

Not the greatest colors though, I know.

enter image description here enter image description here

3
  • Why is China with the color from Antarctica, and Antarctica with the color from Africa (among other similar errors)?
    – Rodrigo
    Commented Oct 8, 2019 at 18:53
  • this seems to be an error in the rnaturalearth package ¯_(ツ)_/¯ Commented Oct 8, 2019 at 20:42
  • you forgot to load dplyr for mutate() Commented Apr 23, 2021 at 3:58
2

The reprojection might fail for points that are located at the backside of the globe. Best solution is to clip the data to the visible hemisphere.

I have given some advice on that here: Where did the polygons go after projecting a map in QGIS? and in the questions in the Linked section of that topic.

1
  • Thank you, Andre, but I got a faster solution here: stackoverflow.com/a/26153202/1086511 I think that clipping manually what the projection algorithm already calculates is not the best solution.
    – Rodrigo
    Commented Oct 2, 2014 at 19:33

Your Answer

By clicking “Post Your Answer”, you agree to our terms of service and acknowledge you have read our privacy policy.

Not the answer you're looking for? Browse other questions tagged or ask your own question.