6

I've got a shapefile that contains thousands of features that can be group by categories. These features are sometime located in the same place so they overlap.

An example of the content of my shapefile is :

id | scientific_name
1  | foo
2  | foo2
3  | foo2
4  | foo

I would like to show the location of each feature depending on the scientific name. So, I've made a thematic map with a different colour for each scientific name. Now, I would to be able to have one map (png, pdf, etc.) per scientific_name (some kind of thematic export).

Using the previous example, I will have :

  • foo.png (with only the features 1 and 4 visible and hide the others)
  • foo2.png (with only the features 2 and 3 visible and hide the others)

To give a better explanation of what I would like to do, here are some screenshots of what I'm trying to achieve :

1) this is my main QGIS project. My data are classified with a different colour for each scientific name (all the data are inside the same layer, but I can split them as well in different layers if needed)
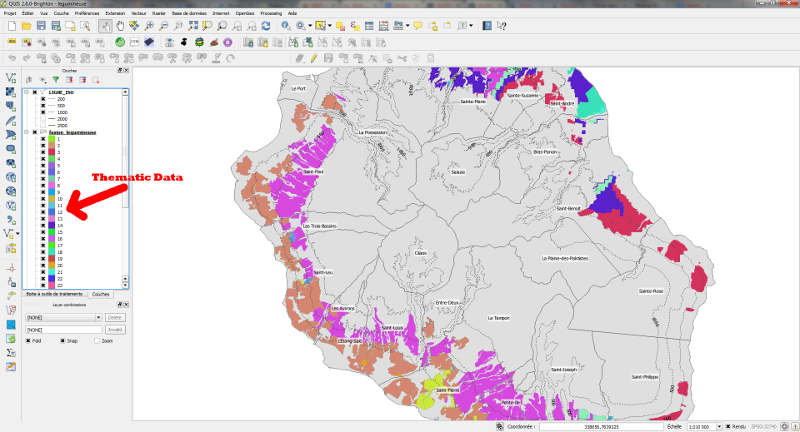
QGIS Thematic Map

2) For each scientific name, I would like to export a map that only display one scientific name
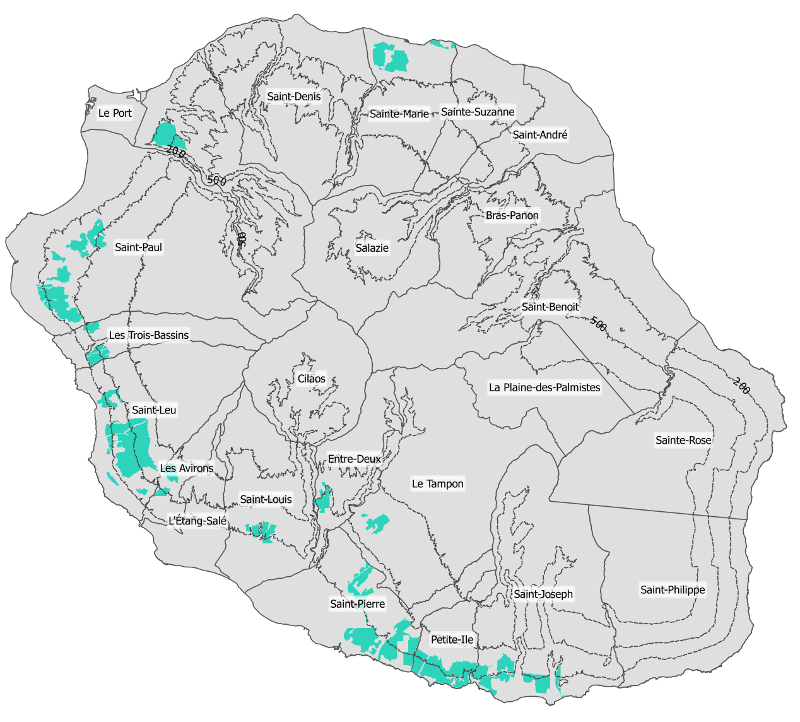
example of desired export

Do you have any idea how I could do that ?

3 Answers 3

1

You could use a combination of the "Layer Combinations" plugin and the Atlas-Function from QGIS. With the Layer Combinations Tool, you can set different views, scales (zoom) and different layer combinations, give them names and choose them in the print composer (down right). With the Atlas-Function you are able to export a set of maps defined by a feature or a expression. Maybe you have to modify the the shape file and add a extra column.

Try around! Hope it helps you! If not, make some screenshots that I can better understand, what you exactly looking for.

1

In QGIS, set your colour scheme for your first image (so in your case, Features 1 and 4 being only visible). When you add a map to composer (by clicking the "Add new map" option), you should see your thematic map. Export as an image or pdf etc.

Next, go back to QGIS and change the colour scheme of the same layer so that Features 2 and 3 are visible. Go back to Composer and select Item Properties in the menu window (right-hand side usually) and click the Update preview. Your map should be updated with the new colours. Export this as an image, pdf etc.

2
  • Hi Jospeh, Thanks for your answer. Finally, this is what I did. But I've got 46 categories and I was thinking to something more automatic. I don't want to have to do it again if someone want to change the title or a logo... Commented Nov 12, 2014 at 10:29
  • Yes, 46 categories is a fair bit of changing! I think the only way to automate this is via Python which unfortunately, I am not adept with. But hopefully others will advise.
    – Joseph
    Commented Nov 12, 2014 at 10:40
0

Just a thought and certainly not tested!

Load the shapefile and style it on the 'scientific-name' field. Then save the style as a QML file. Next, split the shapefile on the 'scientific-name' field to produce 46 shapefiles, one for each category. Then load the 46 shapefiles and batch style them using the MultiQml plugin with the saved QML file.

At this point you should have 46 styled layers that can be ticked or unticked as required to show any possible combination of categories. One print template will be able to handle any combination of layers.

1
  • Hi, Thanks for the idea. While I like the idea of a QML file, I really would like to be able to automatize the map printing process. I would like to find a way to do it without having to ticked and unticked the layers... Commented Nov 14, 2014 at 5:38

Your Answer

By clicking “Post Your Answer”, you agree to our terms of service and acknowledge you have read our privacy policy.

Not the answer you're looking for? Browse other questions tagged or ask your own question.