10

I would like to remove isolated pixels (or clumps of pixels <9) from my raster image.

library(raster)
# create some raster data
r <- raster(ncols=12, nrows=12)
set.seed(0)
r[] <- round(runif(ncell(r))*0.7 )
rc <- clump(r) 

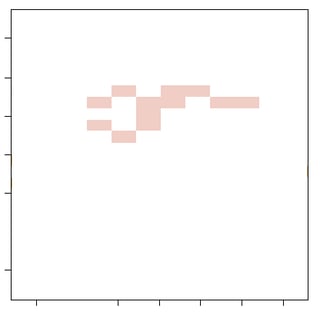
Before removing clumps of pixels <9

enter image description here

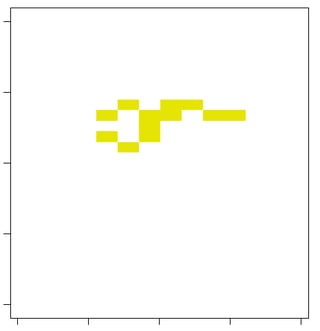
After removing clumps of pixels <9 :

enter image description here

In Erdas, there is the Sieve tool to do this, but how to replace it in R?

2
  • 1
    Look at "Applying a raster sieve by clumping" in Lesson 7: Advanced Raster Analysis
    – gene
    Commented Jan 20, 2015 at 17:03
  • Great, thank you very much, I din´t know this site! :)
    – maycca
    Commented Jan 20, 2015 at 17:35

3 Answers 3

7

Thanks to @gene and https://geoscripting-wur.github.io/AdvancedRasterAnalysis/ I can now answer my question (copied and modified):

library(raster)

# create some raster data
r <- raster(ncols=12, nrows=12)
set.seed(0)
r[] <- round(runif(ncell(r))*0.7 )
r[r==0]<-NA

# extend r with a number of rows and culomns (at each side)
# to isolate clumps adjacents to plot axes 
r2<-extend(r, c(1,1))
rc <- clump(r2, directions = 8) 

# get frequency table    
f<-freq(rc)
# save frequency table as data frame
f<-as.data.frame(f)

# which rows of the data.frame are only represented by clumps under 9pixels?
str(which(f$count <= 9))
# which values do these correspond to?
str(f$value[which(f$count <= 9)])
# put these into a vector of clump ID's to be removed
excludeID <- f$value[which(f$count <= 9)]

# make a new raster to be sieved
formaskSieve <- rc
# assign NA to all clumps whose IDs are found in excludeID
formaskSieve[rc %in% excludeID] <- NA

plot(formaskSieve)

and result wanted (with one row and one column of NA added on each side of raster).

enter image description here

5
#reproducible example
r <- raster(ncols=12, nrows=12)
set.seed(0)
r[] <- round(runif(ncell(r))*0.7 )
rc <- clump(r) 

#extract IDs of clumps according to some criteria
clump9 = data.frame(freq(rc))
clump9 = clump9[ ! clump9$count < 9, ] #remove clump observations with frequency smaller than 9
clump9 = as.vector(clump9$value) # record IDs from clumps which met the criteria in previous step

rc[rc != clump9[1] & rc != clump9[2]] = NA #replace cells with IDs which do not belong to the group of interest 

plot(rc,col="black",legend=FALSE)
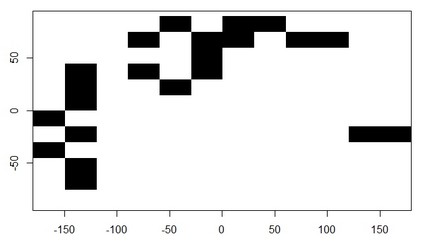
enter image description here

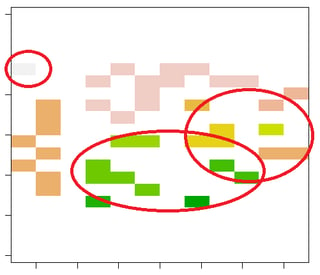
Note that from the clump function, the clump ID "4" had 2 cells in the right side connecting with cells on the left.

head(rc)
    1  2  3  4  5  6  7  8  9 10 11 12
1  NA NA NA NA  2 NA  2  2 NA NA NA NA
2  NA NA NA  2 NA  2  2 NA  2  2 NA NA
3  NA NA NA NA NA  2 NA NA NA NA NA NA
4  NA  4 NA  2 NA  2 NA NA NA NA NA NA
5  NA  4 NA NA  2 NA NA NA NA NA NA NA
6  NA  4 NA NA NA NA NA NA NA NA NA NA
7   4 NA NA NA NA NA NA NA NA NA NA NA
8  NA  4 NA NA NA NA NA NA NA NA  4  4
9   4 NA NA NA NA NA NA NA NA NA NA NA
10 NA  4 NA NA NA NA NA NA NA NA NA NA
1
  • 1
    Thanks Andre, I´ve already realized it and I have used extend tool r2<-extend(r, c(1,1))
    – maycca
    Commented Jan 20, 2015 at 18:10
0

An additional answer for projected data. bfastSpatial::areaSieve() takes a threshold argument, such that clumps smaller than the threshold are removed.

https://www.rdocumentation.org/packages/bfastSpatial/versions/0.6.2/topics/areaSieve

Your Answer

By clicking “Post Your Answer”, you agree to our terms of service and acknowledge you have read our privacy policy.

Not the answer you're looking for? Browse other questions tagged or ask your own question.