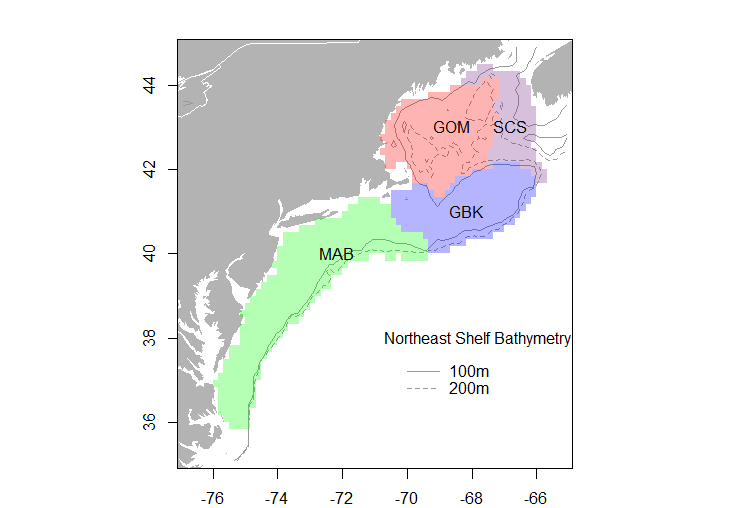
I need to subset data from a NetCDF using a specific shapefile. The data are sea surface temperature and ocean color at 1/4 degree resolution. I have 4 polygons describing the US. Northeast continental shelf large marine ecosystem and it's sub-components that I need to use to extract the data. I am working with monthly composite files from 1982-2014, so this data extraction routine needs to be automated. The files are already subsetted to the approximate working area grid of [35, 45, -80, -60].

Previously, we were converting HDF5 data files to rasters in R and processing them this way, but this method is really inefficient and I am sure there is a better solution in Python using the current NetCDF files.
Thus far I have been using GDAL and Fiona to read in the shapefiles and NetCDF4 to load the data files. I am not sure how to go about subsetting the data. I found this:
GDAL for Python: extracting subdomains from NetCDF file?
But I don't have the foggiest idea about how to subset a NetCDF file using anything other than a simple bounding box, which these polygons most certainly are not.
Point in polygon routines would probably take an eternity to work, but maybe I could subset the data using a smaller bounding box that is rotated to fit these shapes like this as an initial starting point and then do a point-in-poly search:
Subsetting a curvilinear netCDF file (ROMS model output) using a lon/lat bounding box.
Any ideas?
EDIT 1:
I just came across the OpenClimateGIS package which seems that it may fit the bill perfectly... I will have a go with this to see if I can get it to work: http://ncpp.github.io/ocgis/examples.html#advanced-subsetting
