11

Using QGIS version 1.7.

I have a plain text file that lists a set of rgb values against a code. I want to use this colour table to colour a polygon layer by mapping one of its attribute fields ('map_symb') to a code in the text file.

the colour table is very long, and looks like this:

$ head gsv1Msymbology.txt
MAPCODE RED GREEN   BLUE
Oc  143 255 255
WAT 255 255 255
Qa  244 250 202
Qdl 195 239 218
Na  248 255 238
Qd2 227 255 190
Qxw 248 255 238
Qns 255 148 83
Qn  255 202 190
.... 

I want to match my 'map_symb' attribute to a value in MAPCODE, and use the corresponding RGB values to colour the polygons.

Is there a gui way to do this?

3

3 Answers 3

16

On later version of QGIS is easier to perform the requested task.

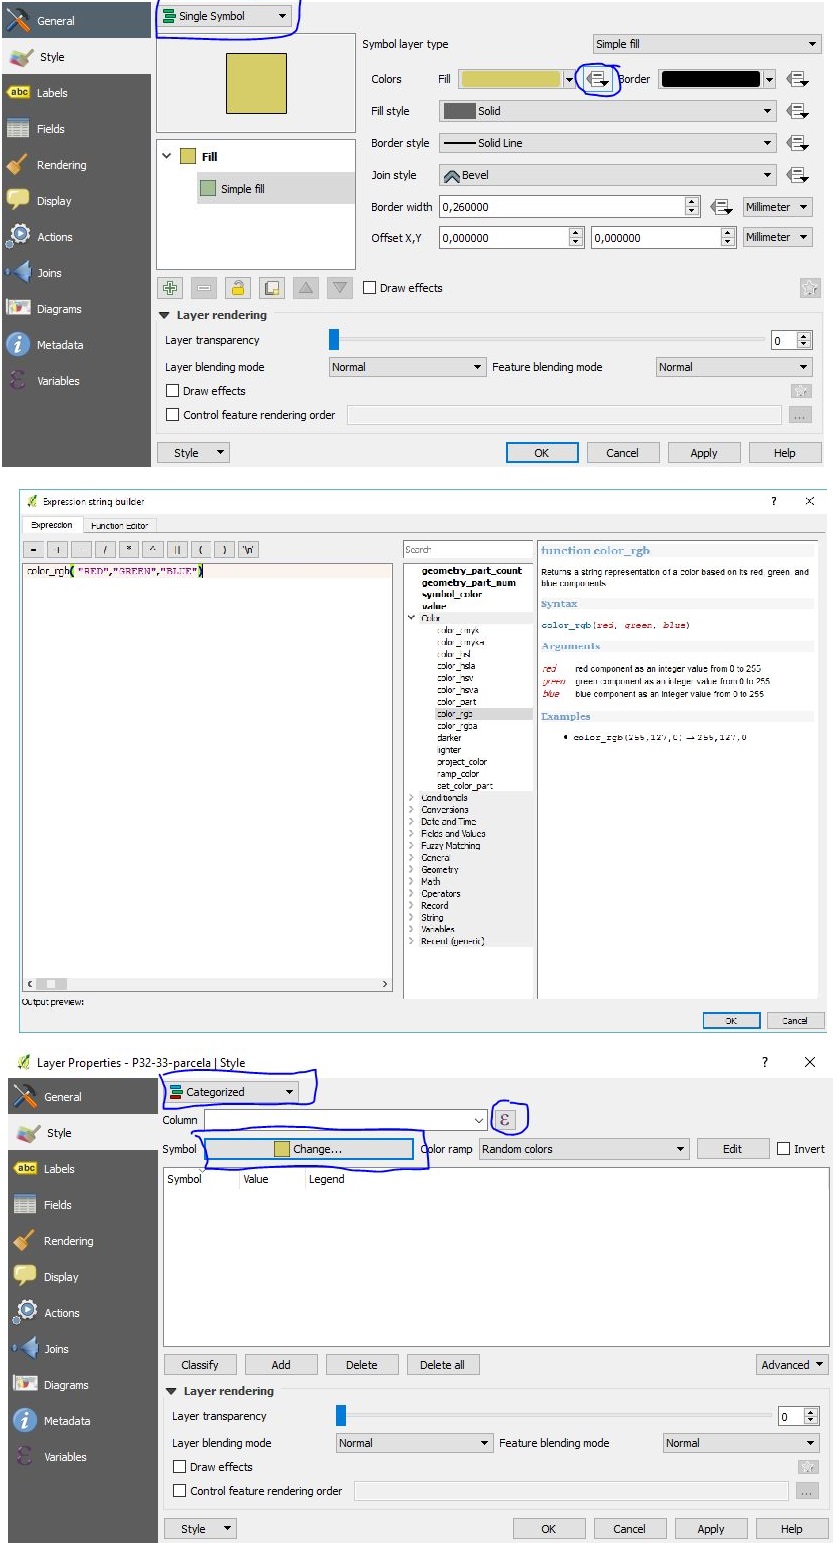
Just open Layer Properties, Style Tab, and make sure Single Symbol is selected. Click the box next to the "Fill" color and choose "Edit.

You will be editing the base color of your polygon bases on RGB colors present on the data table, with a constant border color (you can apply the same criteria if needed).

After hitting "Edit" just put the 3 RGB columns names of your table using the following expression:

color_rgb("R-column","G-column","B-column")

Ok, Apply and your done.

If you need to label and characterize the data in the same manner (for example, to build a legend), just use the Categorized option and apply the same expression to the Symbol and to the Column, identified in the image bellow.

enter image description here

1
  • I have three columns, 'r','g',and 'b', that I used the color_rgb command as follows color_rgb('r','g','b') in the edit dialogue of Fill color. Do you know why it is not changing the colors when I click apply? The fill color box still indicates the default. Commented Jul 17, 2023 at 20:50
10

You can use Python with ElementTree module :

from string import *
from xml.etree import cElementTree as ET

class symbol:
    def __init__(self,b=[]):
            self.typec= typec
            self.b = b
            self.key = ['MAPCODE','R','G','B']
            self.data = dict(zip(self.key,self.b))
            self.symb = ET.SubElement(typec,"symbol")
            self.lower = ET.SubElement(self.symb, "lowervalue")
            self.upper = ET.SubElement(self.symb, "uppervalue")
            self.outline = ET.SubElement(self.symb,"outlinecolor")
            self.outsty = ET.SubElement(self.symb, "outlinestyle")
            self.outtail = ET.SubElement(self.symb, "outlinewidth")
            self.fillc = ET.SubElement(self.symb,"fillcolor")
            self.fillp = ET.SubElement(self.symb,"fillpattern")

    def creation(self):
            self.lower.text = self.data['MAPCODE']
            self.upper.text = self.data['MAPCODE']
            self.outsty.text="SolidLine"
            self.outtail.text="0.26"
            self.outline.set("red",str(self.data['R']))
            self.outline.set("green",str(self.data['G']))
            self.outline.set("blue",str(self.data['B']))
            self.fillc.set("red",str(self.data['R']))
            self.fillc.set("green",str(self.data['G']))
            self.fillc.set("blue",str(self.data['B']))
            self.fillp.text = "SolidPattern"

# QML file creation
intro = ET.Element("qgis")
transp = ET.SubElement(intro,"transparencyLevelInt")
transp.text = '255'
classatr = ET.SubElement(intro, "classificationattribute")
classatr.text= "MAPCODE"
typec = ET.SubElement(intro,"uniquevalue")
classif = ET.SubElement(typec,"classificationfield")
classif.text="MAPCODE"

# RGB file processing              
def main():
    file = "RGB.txt"
    f= open(file,"r")
    while 1 :
        line = f.readline()
        if not line :
            break
        elem = split(line,',') #or tab, or space, or
        symboltag = symbol(elem)
        symboltag.creation()
     result = ET.ElementTree(intro)
     result.write("RGB.qml")

if __name__ == '__main__':
    main()

The style file generated by this script is (and it works) :

  <qgis>
  <transparencyLevelInt>255</transparencyLevelInt>
   <classificationattribute>MAPCODE</classificationattribute>
   <uniquevalue>
      <classificationfield>MAPCODE</classificationfield>
         <symbol>
             <lowervalue>Oc</lowervalue>
             <uppervalue>Oc</uppervalue>
             <outlinecolor blue="143" green="255" red="255" />
             <outlinestyle>SolidLine</outlinestyle>
             <outlinewidth>0.26</outlinewidth>
             <fillcolor blue="143" green="255" red="255"/>
             <fillpattern>SolidPattern</fillpattern>
          </symbol>
          <symbol>
             <lowervalue>WAT</lowervalue>
             <uppervalue>WAT</uppervalue>
             <outlinecolor blue="255" green="255" red="255" />
             <outlinestyle>SolidLine</outlinestyle>
             <outlinewidth>0.26</outlinewidth>
             <fillcolor blue="255" green="255" red="255" /> 
             <fillpattern>SolidPattern</fillpattern>
          </symbol>
              and so...
   </uniquevalue>
</qgis>

You can also use the shapefile module ([shapefile])1 for shapefiles with RGB columns

import shapefile ....
[....]
noduplicates = []

def main():
sf = shapefile.Reader("RGBshape")
for rec in enumerate(sf.records()):
    if rec[1][0] not in noduplicates:
        noduplicates.append(rec[1][0])
        symboltag = symbol(rec[1])
        symboltag.creation()      
    else:
        continue

and so...

0
6

If you want to classify some vector data in a repeatable way then here is what you can do:

  • Load your vector into QGIS.
  • Right-click on the layer in the "Layers" pane on the left side of the screen.
  • Click on "Properties" in the menu that appears.
  • Click on the "Style" tab in the window that appears.
  • There should be a drop-down list item on the screen that says "Single Symbol". Click on it, and change its value to "Categorized".
  • The interface layout will change, giving you a new option labeled "Column". Click on it and select the "map_symb" field.
  • Click the "Classify" button below the large empty field. The empty field will be populated with the contents of the "map_symb" column in your dataset.
  • Double-click on the symbols you want to change. In the window that appears, click the button labeled "Change".
  • This allows you to change the color for the given attribute value.
  • Keep doing this until you have changed colors as required.
  • When you're done, you may want to save the style by clicking the "Save Style ..." button. This will allow you to apply the same style to any other dataset, merely by clicking "Load Style ..." when in this same window. This may be what you were trying to achieve by linking the text file with the dataset, which isn't possible AFAIK. Once you have saved the style, though, you will be able to use it on any following datasets (assuming they have the same attribute values). If you open the style's save file, you'll see that it's just plain text, which you can edit if you want. It is of course possible to just write this file yourself in any text editor, but it's faster and easier doing it via GUI.
  • Click "Apply" to see your changes and "OK" to close the Layer Properties window.
4
  • 1
    That seems like an awful lot of work when the OP already has a table of the desired colors. Is there anyway to go from the original table to what the "Save Style" format is directly?
    – Andy W
    Commented Sep 29, 2011 at 12:13
  • 1
    Actually it's easy. It's how you normally classify vector data in any GIS. I'm starting with a blank canvas and describing each mouse click, just to prevent confusion. You can, of course, write your color specification in the Style format from the get-go. It's simple and fairly human readable. But that's not very portable, and will not work if you make a typo. Just do it with the GUI. Once you've saved the Style file, you can modify it in a text editor and save yourself the headache of navigating a GUI.
    – R Thiede
    Commented Sep 29, 2011 at 12:41
  • 1
    Andy has it by the balls; there are hundreds of MAPCODEs. And yes, I know how to do it manually. Commented Sep 29, 2011 at 22:21
  • Ah, I see. Well, in that case, you may want to classify only a small part of your MAPCODEs, like three of them. Then save the style. Then open the style file and look at how it is formatted. Then just write a script (in, say, Python) to iterate thru your MAPCODE file line by line, and convert it into the style file's format, which you can then apply to your map. I'm not aware of an existing script that does this and unfortunately I'm in the middle of a project, so don't have time to do it myself right now. But if someone could pull it off, it'd be nice to have it posted on here as an answer :)
    – R Thiede
    Commented Sep 30, 2011 at 7:32

Your Answer

By clicking “Post Your Answer”, you agree to our terms of service and acknowledge you have read our privacy policy.

Not the answer you're looking for? Browse other questions tagged or ask your own question.