You need to know something about the meaning, method of acquisition, and processing of the elevation measurements, because slope calculations are fairly sensitive to resolution. You will get lower average slopes, typically, with a coarser resolution or when cell values are cell average elevations rather than spot elevations. In particular, if your grid has been processed by any kind of resampling procedure, that will change the slopes (sometimes dramatically). Note, too, that the average slope within a region is not the same as the slope based on a comparable average of elevations within the same region: the former is going to be at least as great as the latter, and can be tremendously larger. As an extreme example, the average slope in the deeply incised plateaus of West Virginia is high, reflecting the rugged terrain, but a slope based on elevations averaged over large areas (say, over 15 minute intervals) will be almost zero.
Edit
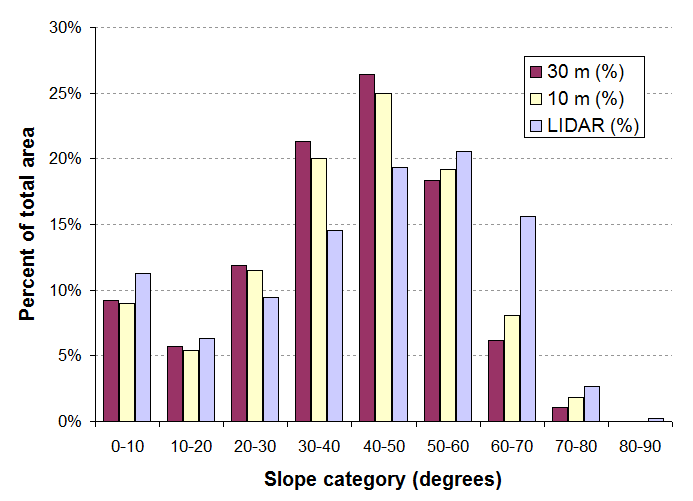
A few years ago I obtained three DEMs of the same area (in Idaho) at 30m resolution, 10m resolution, and a LIDAR dataset (c. 1m resolution) and compared their slope distributions. Here is one graphic from that study:

It shows that as the resolution gets finer, the proportion of high-slope areas goes up. The change from 30m to LIDAR is substantial: the mean slope increases by about 10 degrees. This graph rewards a closer look, too: you can see little change in the low slope areas. Apparently, high-slope rugged areas in the LIDAR DEM get smoothed out in the 10m and 30m DEMs where they become medium-slope areas. Really extreme slopes (above 75 degrees or so) appear only in the LIDAR dataset. Although there may be questions as to which of these datasets is closer to the "truth," clearly the conclusions one draws about slope distributions will vary with resolution.

