9

I have a GPX file with track points and I want to average the points spatially to improve accuracy of the point feature. I can't just make a polygon and find its centroid as the number of overlapping points in a certain location should "weight" the result more than another location with few points. ie. if the field data collector was standing in one spot for 2 minutes I should have the bulk of points 'drifting' around the likely location of the point, and have scattered outliers around that, by averaging spatially based on all the points the outliers would be discounted in favour of the clustered points in the averaging.

Do I have to make a raster grid with small resolution and overlay it on my points and then count the points in each cell, or is there an easier geoprocessing kind of function to simply tell me the center coordinates (or make a new point) for the average center?

2
  • 1
    I'd suggest this question be reopened. The specification about the discarding of outliers makes it a very different issue than simply taking a mean of coordinates as per the linked question and answer.
    – Simbamangu
    Commented Sep 3, 2015 at 16:59
  • 1
    Could you share some sample data? Or otherwise describe just how extreme the 'outliers' are? Do you have any HDOP GPS data saved?
    – Simbamangu
    Commented Sep 4, 2015 at 14:18

2 Answers 2

7
  1. Open the Processing Toolbox window pane: Processing menu -> Toolbox
  2. At the bottom of the window pane, enable Advanced interface
  3. From the Processing Toolbox -> QGIS Algorithms -> Vector analysis tools -> Mean coordinate(s).

Edit to discount outliers: Here is one way to discount outliers using inverse distance weighting. In this approach, points that have a small, average distance to other points will have a higher weight, and more influence on the mean point's location.

  1. Create a distance matrix with summary stats that describe the point separations:

    • Processing Toolbox -> QGIS Algorithms -> Vector analysis tools -> Distance matrix
    • Under type: Summary distance matrix
    • Pick the number of points you think should be considered. A larger number up to the number of points you have will be more accurate, but it will take longer to compute.
  2. Join the distance matrix to your points layer:

    • Right click on your vector layer in the layers window pane
    • Go to properties
    • Along the left hand side, choose Joins
    • Hit the green plus sign at the bottom to add a table
    • The join layer is the distance matrix
    • Join field and target field should be a unique identifier, e.g., row number
  3. Once they are joined, calculate inverse distance. This will be used to weight the mean point:

    • Open the attribute table of the points layer
    • Click on open field calculator
    • Output field name: inv_dist (or whatever)
    • Output field type: Decimal number (real)
    • Expression: 1 / "Distance matrix_MEAN"
    • hit ok to calculate
  4. Run mean coordinates with inverse mean distance as the weighting field:

    • Processing Toolbox -> QGIS Algorithms -> Vector analysis tools -> Mean coordinate(s)
    • Input layer is your original point vector layer
    • Weight Field is inv_dist
    • hit ok

The result will be a mean location in which the points that are on average far away from other points will have been discounted.

5

First, you do not have to make a raster and count points to accomplish this. You say your goal is to calculate an "average center". If you mean that literally, then you want to calculate a "mean center", which is done by averaging the X coordinates to find the mean X and the Y coordinates to find the mean Y. This is accomplished in QGIS with Vector→Analysis Tools→Mean Coordinates…. If your coordinates are in distinct batches (survey 1, survey 2), but contained in the same data file, you can designate a Unique ID Field, and mean coordinates will calculated separately for each group.

You say you are concerned about outliers. If you want to minimize the influence of outliers, you might want to calculate the median center, instead of the mean center. However, while this capability is available in ArcGIS, it is not (to the best of my knowledge) available in QGIS (core or plugins). Calculating the median center, which represents the point with the minimum aggregate travel distance to all other points, is iterative and may have more than one solution. If you want to do this in QGIS, you would have to program it.

However, based on your description of your problem, I think you can forget about median center and just calculate mean center with the Mean Coordinates tool. If you have multiple points near the "real" center of your place of interest, they will tend to overcome the pull of single outliers. It should be noted that 1) values not near the average are not necessarily outliers, and 2) unless the outliers are biased in a particular direction (e.g. the points are GPSed on an East facing hill and the surveyor tended to drift downhill/East), they will tend to cancel and not influence the average.

As a short, completely unscientific demonstration, a bunch of human-placed, not-really-random points produce a mean center that looks like it's not badly influenced by a couple of distant points.
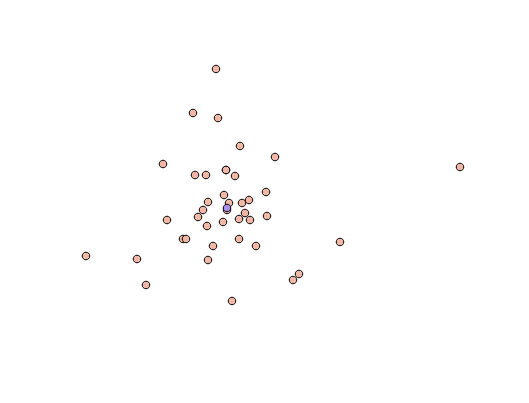
Sort of random points and the Mean Center

Your Answer

By clicking “Post Your Answer”, you agree to our terms of service and acknowledge you have read our privacy policy.

Not the answer you're looking for? Browse other questions tagged or ask your own question.