First, you do not have to make a raster and count points to accomplish this. You say your goal is to calculate an "average center". If you mean that literally, then you want to calculate a "mean center", which is done by averaging the X coordinates to find the mean X and the Y coordinates to find the mean Y. This is accomplished in QGIS with Vector→Analysis Tools→Mean Coordinates…. If your coordinates are in distinct batches (survey 1, survey 2), but contained in the same data file, you can designate a Unique ID Field, and mean coordinates will calculated separately for each group.
You say you are concerned about outliers. If you want to minimize the influence of outliers, you might want to calculate the median center, instead of the mean center. However, while this capability is available in ArcGIS, it is not (to the best of my knowledge) available in QGIS (core or plugins). Calculating the median center, which represents the point with the minimum aggregate travel distance to all other points, is iterative and may have more than one solution. If you want to do this in QGIS, you would have to program it.
However, based on your description of your problem, I think you can forget about median center and just calculate mean center with the Mean Coordinates tool. If you have multiple points near the "real" center of your place of interest, they will tend to overcome the pull of single outliers. It should be noted that 1) values not near the average are not necessarily outliers, and 2) unless the outliers are biased in a particular direction (e.g. the points are GPSed on an East facing hill and the surveyor tended to drift downhill/East), they will tend to cancel and not influence the average.
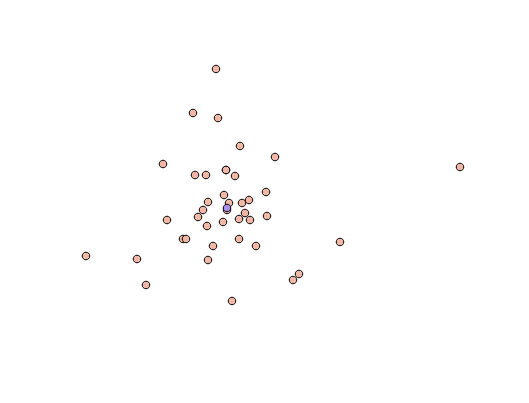
As a short, completely unscientific demonstration, a bunch of human-placed, not-really-random points produce a mean center that looks like it's not badly influenced by a couple of distant points.


