10

I'm am having some trouble plotting my spatial data using ggplot2. The map looks fine when plotted using spplot, so I'm assuming that the tearing occurs at the fortify stage.

The code is as follows:

#install the packages
library(rgdal)
library(mapproj)
library(raster)
library(rgeos)
library(ggplot2)
library(plyr)

if (!require(gpclib)) install.packages("gpclib", type="source")
gpclibPermit()

setwd("C:/Users/My Documents")

#read in laa to regional mapping
#must aggregate to higher level regions as data is provided at this higher level
laa_region_mapping <- read.csv("laa_region.csv", header = TRUE)

#read in LAA polygons
laa_polygons <- readOGR("ctyua_ew_generalised_WGS84.json", "OGRGeoJSON")

#merge by laa to add region column to polygon data
laa_polygons_with_region_data <- merge(laa_polygons, laa_region_mapping,
                                by.x = "CTYUA13NM", by.y = "LAA",
                                all.x = TRUE, all.y = TRUE)

# aggregate laa polygons by the 21 regions (aggregate by regoin_code)
region_polygons <- raster::aggregate(laa_polygons_with_region_data, "region_code")

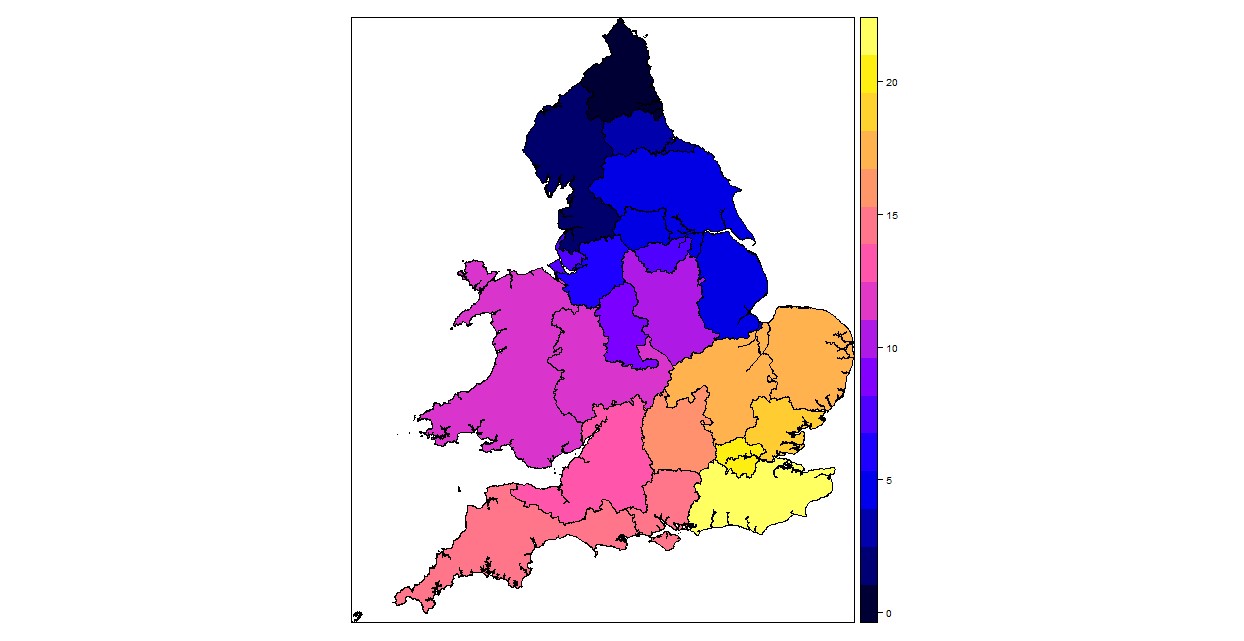
The aggregate has worked, as can be seen by the spplot (note: I found how to aggregate by the regions from this SE post: Join spatial polygons by code in R)

#plot the resulting polygons using spplot
spplot(region_polygons)

enter image description here

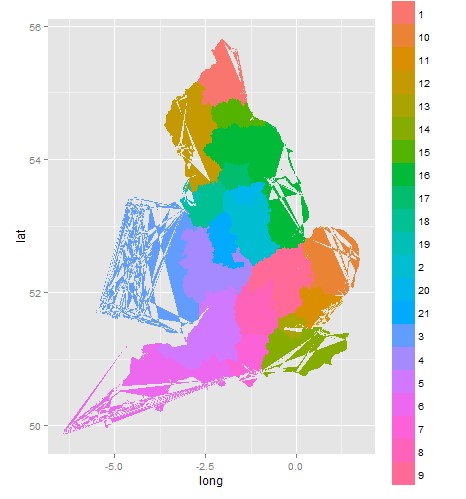
But when I fortify the spatial data so that I can use ggplot, there is tearing around the edges.

#fortify and merge to create the data frame ggplot will show on the map
region_polygons@data$id <- rownames(region_polygons@data)
region_polygons.points <- fortify(region_polygons, region = "id")

# plot the fortified df using ggplot
ggplot(data = region_polygons.points, aes(x= long, y = lat, group = id, fill=id)) + geom_polygon()

enter image description here

How can I stop this tearing?

I've looked at similar responses on SE, but the responses suggest that tearing occurs during a merge (What is the cause of 'tearing' of polygons (artifacts) using R, ggplot and geom_polygon?). I think my tearing occurs at the fortify stage as the spplot before fortifying looks fine.

1
  • you need to generalise your dataset first to eliminate the issue (your program cannot handle that many vertices)
    – Mapperz
    Commented Oct 9, 2015 at 13:36

1 Answer 1

15

You should you use group=group in the aes mapping. Here is a reproducible example of your problem:

library("ggplot2")
library("raster")

x <- getData('GADM', country='GBR', level=2)
y <- fortify(x, region="NAME_2")
head(y)
#     long   lat order  hole piece      group       id
# 1 -2.049 57.23     1 FALSE     1 Aberdeen.1 Aberdeen
# 2 -2.049 57.23     2 FALSE     1 Aberdeen.1 Aberdeen
# 3 -2.049 57.23     3 FALSE     1 Aberdeen.1 Aberdeen
# 4 -2.050 57.23     4 FALSE     1 Aberdeen.1 Aberdeen
# 5 -2.050 57.23     5 FALSE     1 Aberdeen.1 Aberdeen
# 6 -2.050 57.23     6 FALSE     1 Aberdeen.1 Aberdeen


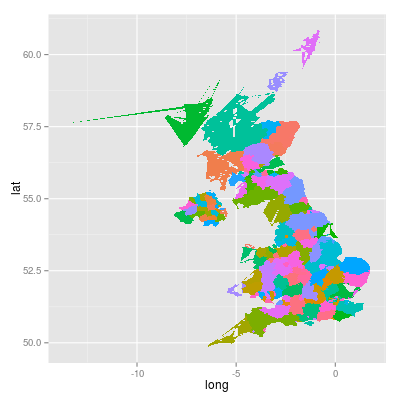
# wrong group aesthetic
ggplot(data=y, aes(y=lat, x=long, group=id, fill=id)) +
  geom_polygon() + 
  guides(fill=FALSE)

wronge aes-group

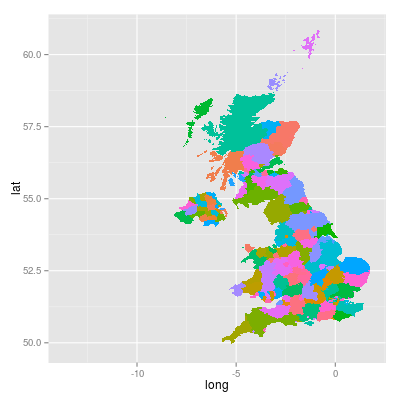
# fixed plot
ggplot(data=y, aes(y=lat, x=long, group=group, fill=id)) +
  geom_polygon() +
  guides(fill=FALSE)

fixed plot

3
  • 1
    Thank you @rcs this is exactly the problem. It's fixed now.
    – annievic
    Commented Oct 9, 2015 at 13:28
  • 4
    Short explanation: In a fortified spatial polygons data set, id is the feature id, and group is the id of individual rings (islands, holes etc) . So if you draw with id as the group it draws all the bits of your feature as one ring, hence the "tearing" as it jumps between islands.
    – Spacedman
    Commented Oct 11, 2015 at 11:25
  • For posterity, I'll leave another suggestion here since I see it often... A common reason for polygon tearing is unsorted data. If specifying the correct group aesthetic doesn't solve it (which doesn't apply to this specific example), trying y <- y[order(y$order),] probably will. The order column is created by the fortify function for this very reason.
    – dmp
    Commented Dec 28, 2018 at 20:58

Your Answer

By clicking “Post Your Answer”, you agree to our terms of service and acknowledge you have read our privacy policy.

Not the answer you're looking for? Browse other questions tagged or ask your own question.