1

I have a (very) long list of casinos. Each casino has:

  • latitude
  • longitude
  • boss (a single boss runs from 1 to 50 casinos)

Sample:

40.642 -73.997 Freddy Queens
40.680 -73.985 Freddy Queens
40.697 -73.949 Freddy Queens
40.651 -73.968 Freddy Queens
40.772 -73.981 Manhattan Michael
40.813 -73.939 Manhattan Michael
40.755 -74.000 Manhattan Michael
40.781 -73.964 Manhattan Michael
40.721 -74.062 Nicole Je. Polizzi
40.750 -74.042 Nicole Je. Polizzi
40.694 -74.090 Nicole Je. Polizzi
[... 70,000 casinos for 27,000 bosses ...]

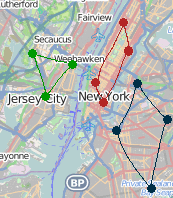
From this data I want to generate a map like this:

map

Ideally one random color per boss. In my world the casinos of each boss are supposed to not "overlap" too much with other bosses, so my final goal is to use this map to find anomalies (casinos that should be transferred to a different boss because they are clearly in that boss' "territory"). Boss "territories" do not match any official geographical subdivisions, for all that matters the same problem could be set on Mars (Earth map background would be nice though).

Is there a webapp to which I could feed this data (CSV) and that would show this kind of map? It can look different, for instance monochrome areas would be OK too, as long as it can be used to detect anomalies. A webapp would be the best as many GIS-illiterate people need to quickly check it every once in a while.


I have tried geojson.io but it can not colour points, all points appear equal.

I have tried Mapbox, but it does not seem to support metadata (such as boss) import, and even less modifying a marker's style based on that metadata.

0

1 Answer 1

2

Using turf.js with Leaflet, you should be able to create the web map you describe. See this example:

http://jsfiddle.net/nathansnider/rzyvudkb/

I used an online converter to create a GeoJSON object from your data. The boss names are retained in the GeoJSON properties, so they can be used to filter the casinos. The method I'm using here also relies on a separate array containing only the boss names, which I just made by hand for this example data.

Iterating over the list of bosses, turf.js does all the hard work. The turf.filter function extracts the casinos for each boss, and the turf.convex function creates the convex hulls:

for (var i in bosses) {
    //create random color
    var bosscolor = '#' + ('000000' + Math.floor(Math.random() * 16777215).toString(16)).slice(-6);
    //filter casinos by boss
    var bossowned = turf.filter(casinos, "boss", bosses[i]);
    //create Leaflet layer for casinos run by this boss
    L.geoJson(bossowned, {
        pointToLayer: function (feature, latlng) {
            return L.circleMarker(latlng, {
                color: bosscolor,
                radius: 5,
                fillOpacity: 0.9
            });
        }
    }).addTo(map);
    //create convex hull of boss territory
    var hull = turf.convex(bossowned);
    //create Leaflet layer for convex hull
    L.geoJson(hull, {
        color: bosscolor,
        opacity: 0.9, 
        fillOpacity: 0.7
    }).bindPopup(bosses[i]).addTo(map);
}

Depending on how many casinos there are in your "(very) long list," you may also need to use something like Leaflet.markerCluster to cut down on the number of points being displayed. Leaflet can get a bit sluggish after about 10,000 points or so are added to the map.

1
  • Great! There are 70,000 casinos for 27,000 bosses, I just added this information in the question, thanks! Commented Nov 12, 2015 at 6:37

Your Answer

By clicking “Post Your Answer”, you agree to our terms of service and acknowledge you have read our privacy policy.

Not the answer you're looking for? Browse other questions tagged or ask your own question.