4

I have got a geographic point distribution with N prehistoric settlements with a size of x and want to compare the distribution with an economic simulation, which produces M settlements (Usally N > M). I've done about 110 runs with different parameters and now I'm looking for a best-fit model. Therefore I calculate the Kernel Density Estimation for the real settlemts (x_dens), the simulation results (y_dens) and for the M-biggest real settlements (xM_dens) and want to compare the cell values of two kernel density estimations in R.

As a first step, i am using the function density.ppp from the Package "spatstat".

x_dens <- density(x_ppp, sd, eps=rw, edge=TRUE, at="pixels")
x_ras <- raster(x_dens, crs="+proj=utm +zone=35 +ellps=WGS84 +datum=WGS84 +units=m +no_defs +towgs84=0,0,0")

y_dens <- density(y_ppp, sd, eps=rw, edge=TRUE, at="pixels")
y_ras <- raster(y_dens, crs="+proj=utm +zone=35 +ellps=WGS84 +datum=WGS84 +units=m +no_defs +towgs84=0,0,0")

xM_dens <- density(xM_ppp, sd, eps=rw, edge=TRUE, at="pixels")
xM_ras <- raster(xM_dens, crs="+proj=utm +zone=35 +ellps=WGS84 +datum=WGS84 +units=m +no_defs +towgs84=0,0,0")

The next step includes the calculation of the cell differences for x with xM, to see which would be minimum error for my M simulated settlements:

xxM_comp <- sqrt(((x_ras - xM_ras)^2 / x_ras))
xxM_comp [!is.finite(xxM_comp )] <- 0
xxM_comp_result <- sum(xxM_comp @data@values)

As a next step, i'm doing the same for my Y-simulated settlements:

xy_comp <- sqrt(((x_ras - y_ras)^2 / x_ras))
xy_comp [!is.finite(xy_comp )] <- 0
xy_comp_result <- sum(xy_comp @data@values)

To evaluate the best-fit model, i caluclate:

results <- xy_comp_results/xxM_comp_result

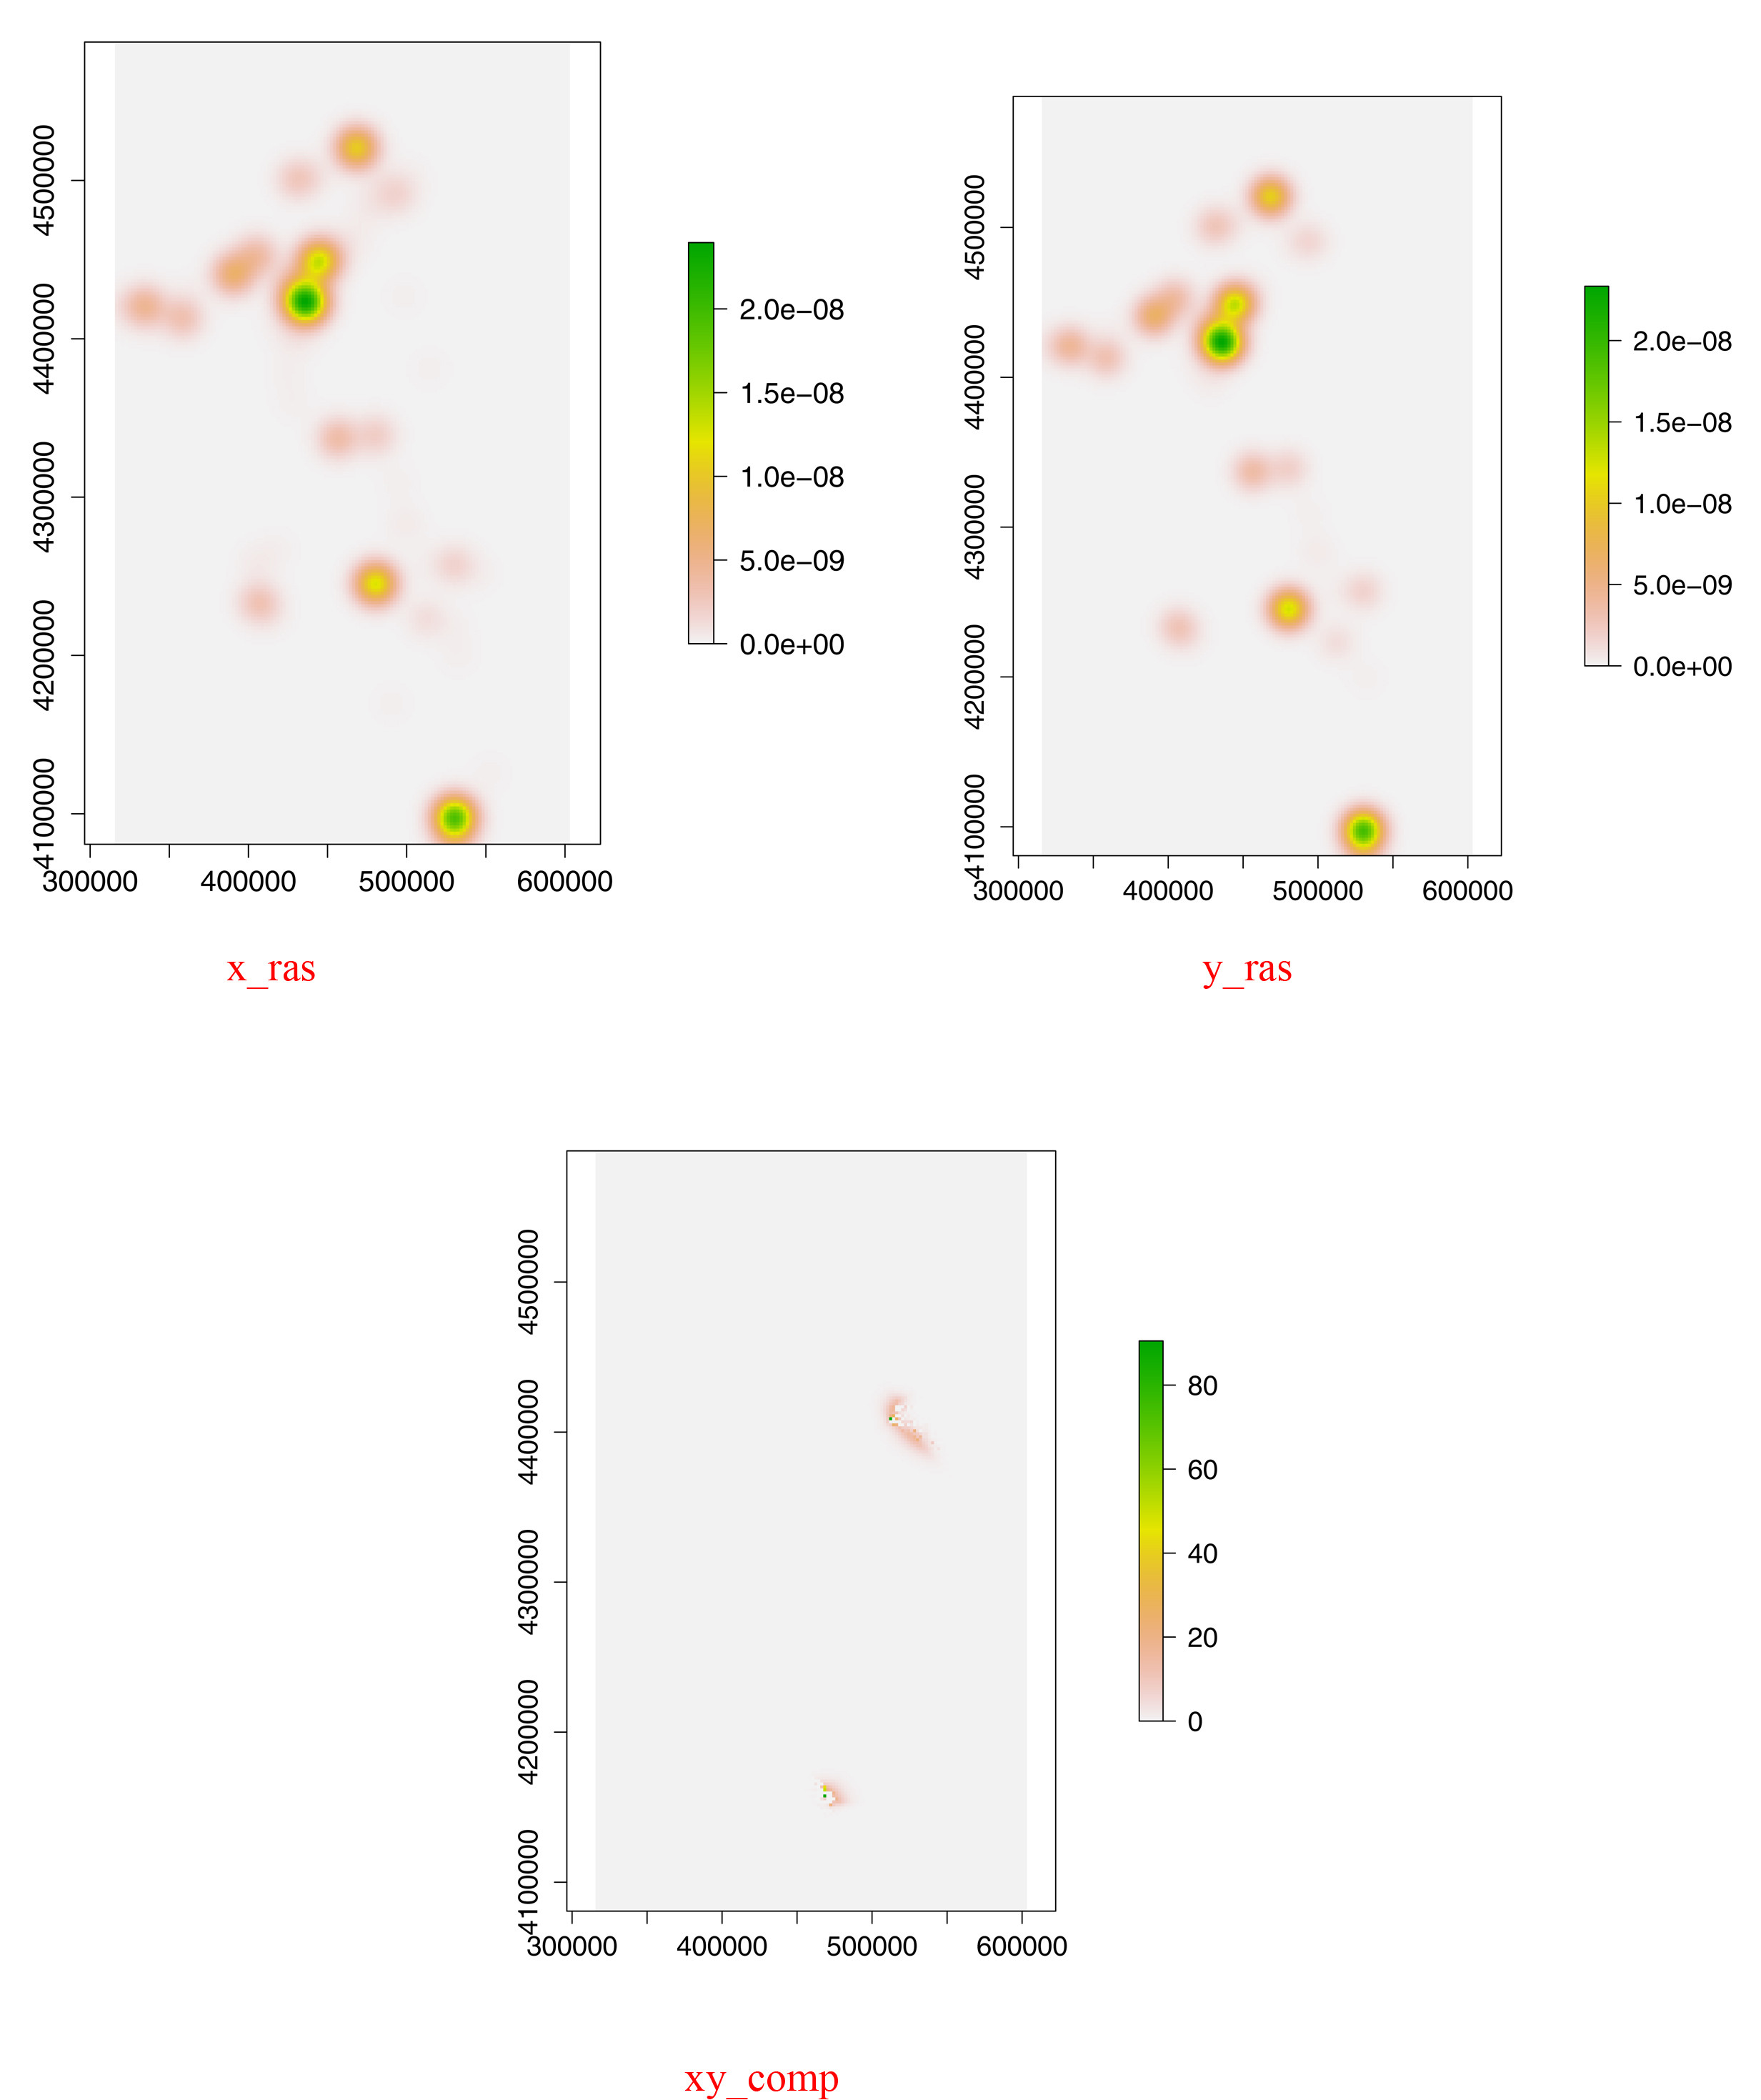
xy_comp shall result in a new raster layer, which shows the differences in both point pattern, but the resulting cell values are enormously high at some points and as a consequence xy_comp_result has a illogically high value. It is due to the fact, that some pixel values of x_ras much to small compared with y_ras. Do you have got any suggestions, how to solve this problem. I've tried to remove outliers, but I did not get proper results.

xy_compare

The methodology is described in D. Stelder, Where do Cities Form? A Geographical Agglomeration Model for Europa, Journal of Regional Science 45 (4), 2005, 657-679 (http://www.regroningen.nl/stelder/doc/JRS_nov2005_c.pdf) Starting with page 669.

11
  • What about extent and resolution of your rasters (x_ras,y_ras)? You need x_ras,y_ras to have the same extent and resolution, and then if you only want the differences you can try diff_rast = x_ras - y_ras.
    – geo_dd
    Commented Jan 26, 2016 at 14:41
  • Thank you very much for your answer! x_ras and y_ras have got the same resolution as well as the same extent. I need the result of x_comp_result for further calculation. I want to compare a prehistoric settlement pattern with the results of an (economic) simulation.
    – Celaeno
    Commented Jan 26, 2016 at 15:00
  • Have you thought of standard deviation? You can create a stack with your rasters: stack_rasters=stack(x_ras,y_ras). Then you can use the standard deviation like this: difference=calc(stack_rasters, fun=sd). (not tested).
    – geo_dd
    Commented Jan 26, 2016 at 15:19
  • Might be a very good idea, but now i get following error: "Error in (function (classes, fdef, mtable): unable to find an inherited method for function ‘calc’ for signature ‘"RasterStack", "numeric"’"
    – Celaeno
    Commented Jan 26, 2016 at 15:45
  • I believe that you are, in fact, using a ppp object and the density function from spatstat, not raster. This is not a standard KDE and should not be treated as such. The results are an isotropic density and represent the intensity function and an expectation of the spatial process. Across scales, these intensity functions are not comparable. Commented Jan 26, 2016 at 21:14

1 Answer 1

3

I am curious as to why you are not approaching this problem using a point pattern analysis? It is apparent that you are after a multiscale comparision but, it is not clear as to what end or what type of supported inference would be made. The type of standardization that your are attempting is hinting that a PPA would be a more supported methodology.

Depending on your hypothesis, I would highly recommend taking a look at the Geits-Ord or Ripley's-K statistic(s). If you have covariates there are correlogram methods implementing the partial Mantel test, which if permuted, support exploratory analysis. Another option for a marked point process would be the family of scan statistics, which can be specified using assumed point process distributions (ie., Poisson, Gaussian, Binomial) and as a multiscale model. All of these methods provide a spatially lagged (multiscale) evaluation of the spatial process and avoid many of the issues associated with kernel density estimates, which is never really considered a supported inferential method. For a robust inference you could formalize a point process model, in a hierarchical Bayesian framework (MCMC), using the estimated intensity function.

Now, if I have misunderstood and you, in fact, want to integrate the volume of two kernel density estimates you could follow one of the methodologies presented in Hurlbert (1978) that provides mathematical definitions for integrating niche volume overlap. The equations are relevant to any volume integration and the paper is available on JSTOR.

Hurlbert, S.H., (1978) The Measurement of Niche Overlap and Some Relatives. Ecology 59(1):67-77

3
  • Thank you very much for your help! I think, that i was looking for the mantel test all the time. I've tried to use it, but i've got a distant matrix with different numbers of rows and columns. Is there a way to perform a mantel test with a n*m-matrix?
    – Celaeno
    Commented Jan 28, 2016 at 13:32
  • What have you tried? You do not need a symmetric row/col matrix for a Mantel or partial Mantel. The package mpmcorrelogram supports Mantel and partial Mantel tests and correlograms. Commented Jan 28, 2016 at 14:11
  • I've used mantel from the ade4 package (ats.ucla.edu/stat/r/faq/mantel_test.htm), but with mpmcorrelogram everything works - thanks a lot!
    – Celaeno
    Commented Jan 29, 2016 at 10:21

Your Answer

By clicking “Post Your Answer”, you agree to our terms of service and acknowledge you have read our privacy policy.

Not the answer you're looking for? Browse other questions tagged or ask your own question.