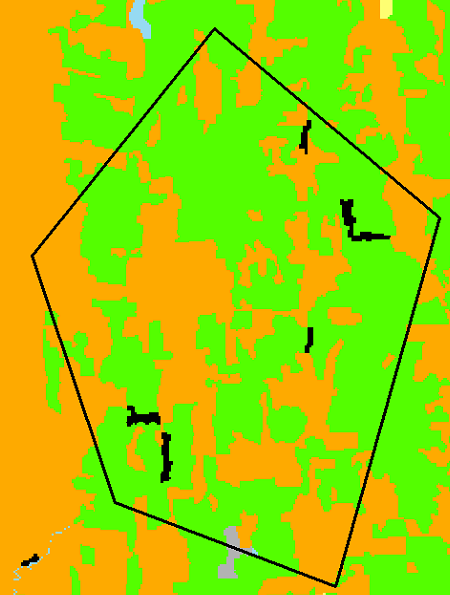
If I understand your specified model correctly, a separate covariate for each landcover type proportion. Yes, the spatial data structure will need to be addressed. You will need to create a separate raster for each landcover type that represents proportion of each given type at the appropriate scale. Depending on how your independent variables were derived, this could take the form of a focal (NxN window or radius) or a zonal function (proportion within each discrete trapping unit).
I am going to mostly ignore any issues with model specification and aim you towards the answer. Although, I do encourage you to really think about your model structure and dig into fit before drawing inference or conclusion around a spatial estimate. Keep in mind that your independent variables are being drawn from the same process and, as such, are not entirely independent. This would be a case where something like AIC would really fail. I am also assuming that your random effect are the trapping units. Although, if you are controlling for the effect it would be a fixed effect. This is also most definitely a Modifiable Areal Unit Problem (MAUP) issue and you should dig into the literature to understand how this has effected your analysis. In your case, the most relevant literature will be in relation to analysis of game units (hunting zones).
The raster package provides an interface, for the raster object classes, to the generic predict function. The way the generic works is that, if needed, each package writes a predict function for the specific model object type produced by the package. This can be done in a way the when "predict" is called it recognizes the object class and calls the correct predict function. In this way you can just call predict on the raster object, representing the model covariates, and pass your model to it with the relevant arguments. This is a multilevel call because it first calls the raster predict and then that function calls the appropriate predict function for the model, all handled without you ever knowing (thanks Robert H).
Just keep in mind that your rasters need to represent your covariates. So, if your raster is nominal and not proportion of landcover types, then you will need to calculate a raster that represents the percents at the scale the model was constructed. If you just pulled the values of x from the raster than this is taken care of. Also, if your model was multivariate then your rasters need to share common number of rows, columns, origin coordinates and cell size. You would then read the data in as a raster stack or brick. I have a tutorial for implementing a random forests model using spatial data on my Quantitative Spatial Ecology website. This tutorial has example data and provides usage of the predict function for making a spatial estimate.
Now, here is where it may get ugly. I do not believe that the developers of glmm have written a formal predict function. Although, the lme4 library provides a predict function "predict.merMod" that should handle this object class. However, I am not sure that R's predict generic will catch that this is the predict function for this object class. Because of this you may need to explicitly pass the "fun" argument, in predict.raster, the "predict.merMod" funciton.


