I am trying to perform an interpolation to my 3D array (sub-block of MODIS time series dataset with a shape of (46,960,960)) using numpy linear interpolation method to replace cloud pixels with interpolated values. The interpolation function is designed not to create a new array but simply replace the nan values with interpolated values. The function is shown below:
def interpolate(array):
    arrN=np.array(array, copy=False)
    ix=-np.isnan(arrN)
    idxTrue=ix.nonzero()[0]
    valueTrue=arrN[-np.isnan(arrN)]
    countFalse=np.isnan(arrN).ravel().nonzero()[0]
    arrN[np.isnan(arrN)]=np.interp(countFalse,idxTrue,valueTrue)
    # Got this algorithm from a discussion forum
arrVeg holds my 3D array as described above. The next process will simply loop to each index in my 3D array to access the time series values of each index. Then it will perform interpolation to replace nan with an interpolated value.
dim=arrVeg.shape
for r in range(0,dim[0]):
    for c in range(0,dim[1]):
        interpolate(arrVeg[:,r,c])
I checked it with a sample dataset (1D array) and the interpolation seems to be working fine (see below). It also works with a small sample of (3,3,3) matrix. However, if I ran it with my real dataset I noticed that all the values in my array that are assigned to np.nan were just converted to zero.
>>> File=pd.read_csv("J:\\MODIS\\Test\\Test_Alg2.csv")

>>> pixr=np.array(File.PIXR)
>>> array([0, 0, 0, 0, 0, 0, 0, 1, 0, 1, 0, 1, 0, 3, 3, 1, 3, 1, 3], dtype=int64)

>>> ndvi=np.array(File.NDVI)
>>> array([6748, 6920, 6698, 6631, 6466, 4810, 4161, 3508, 3113, 2837, 3607, 3519, 3519, 2007, 4125, 4933, 6832, 5236, 2998], dtype=int64)

>>> filter=np.where(pixr==3,np.nan,ndvi)
>>> array([ 6748.,  6920.,  6698.,  6631.,  6466.,  4810.,  4161.,  3508., 3113.,  2837.,  3607.,  3519.,  3519.,    nan,    nan,  4933., nan,  5236.,    nan])

>>> interpolate(filter)
array([ 6748.,6920.,  6698.,  6631., 6466., 4810., 4161., 3508., 3113., 2837., 3607., 3519., 3519., 3990.33333333, 4461.66666667, 4933. , 5084.5, 5236., 5236.])
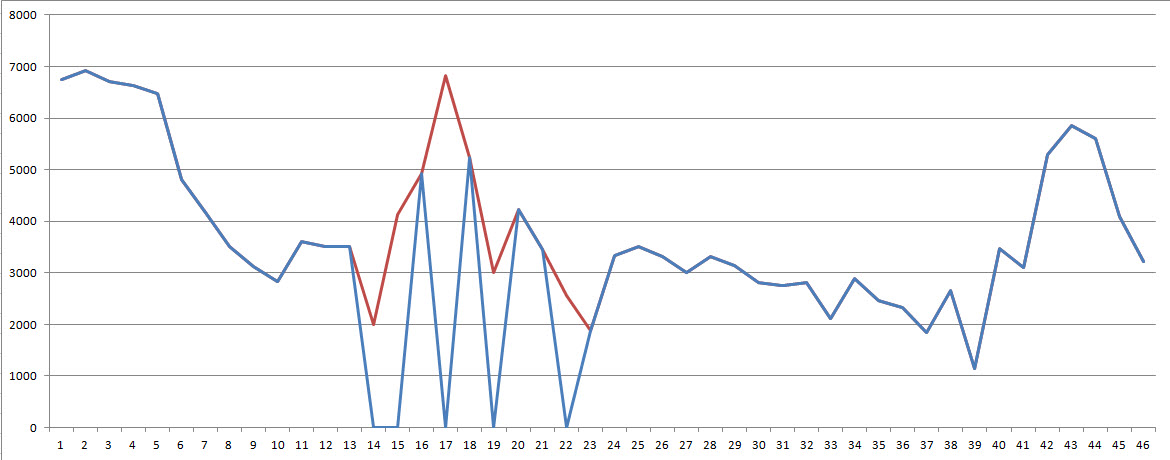
I checked the output of my processed data and the graph look like the image below. The blue line supposed to be the interpolated line, and the red line is the original NDVI value. Most of the pixels that are flag as cloud and was assigned by np.nan were just converted to zero. I checked my script for two days now and I haven't figured out yet what is causing this unusual behavior.
This is the function I am using to create my 3D array.
def array_stack(ndvi,qflag,xrows1,xrows2,yrows1,yrows2): #this should be list
    index=np.arange(0,len(ndvi))
    arrstack=np.empty(shape=(46,abs(xrows2-xrows1),abs(yrows2-yrows1))) #dtype=float
    for nv,q,x in itertools.izip(ndvi,qflag,index):
        arrndvi=gdalnumeric.LoadFile(nv)[xrows1:xrows2,yrows1:yrows2]
        #print "%s, x1=%s, x2=%s, y1=%s, y2=%s" %(nv,xrows1,xrows2,yrows1,yrows2)
        arrqflag=gdalnumeric.LoadFile(q)[xrows1:xrows2,yrows1:yrows2]
        mask_clouds=np.where(arrqflag==3,np.nan,arrndvi)
        arrstack[x,:,:]=mask_clouds
    return arrstack
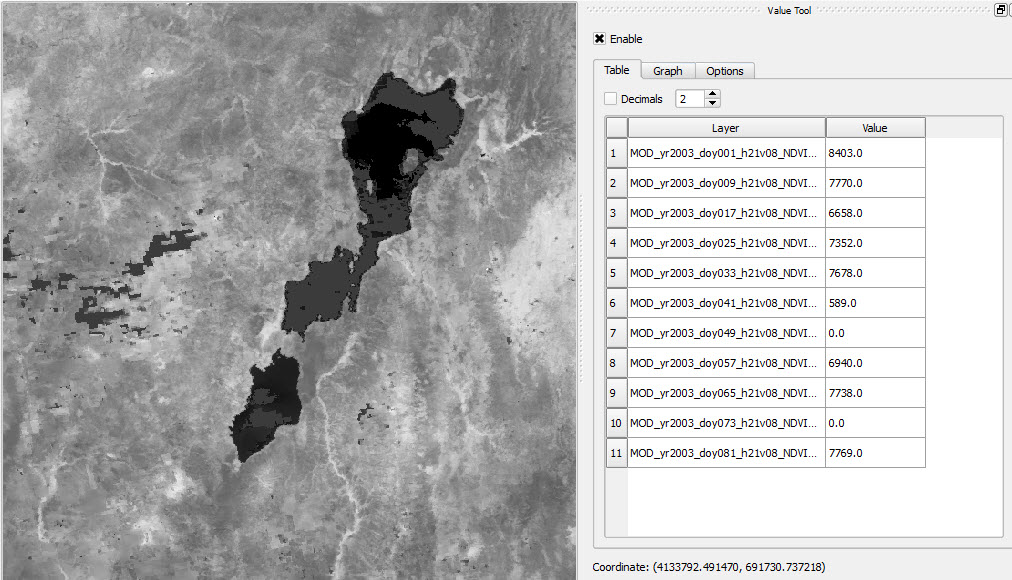
Snapshot of my processed image. If you look at the table on the right side the value zero are the cloud pixels. If you look on the image, the grayish color are the cloud pixels also.


dim=arrVeg.shape for r in range(0,dim[1]): for c in range(0,dim[2]): interpolate(arrVeg[:,r,c])if you want to interpolate through all x/y locations and interpolate along the year axis.