I want to see how accurate/representative a centroid's datapoint value is compared to averaged multiple datapoints values for the same polygon. There are MANY polygons in the same shapefile.
I have a way to call an API based on lat lons. But I am limited in the number of API calls i can make. So I need to explore a few test cases - see the fewest number of points I need to get reasonable data representation.
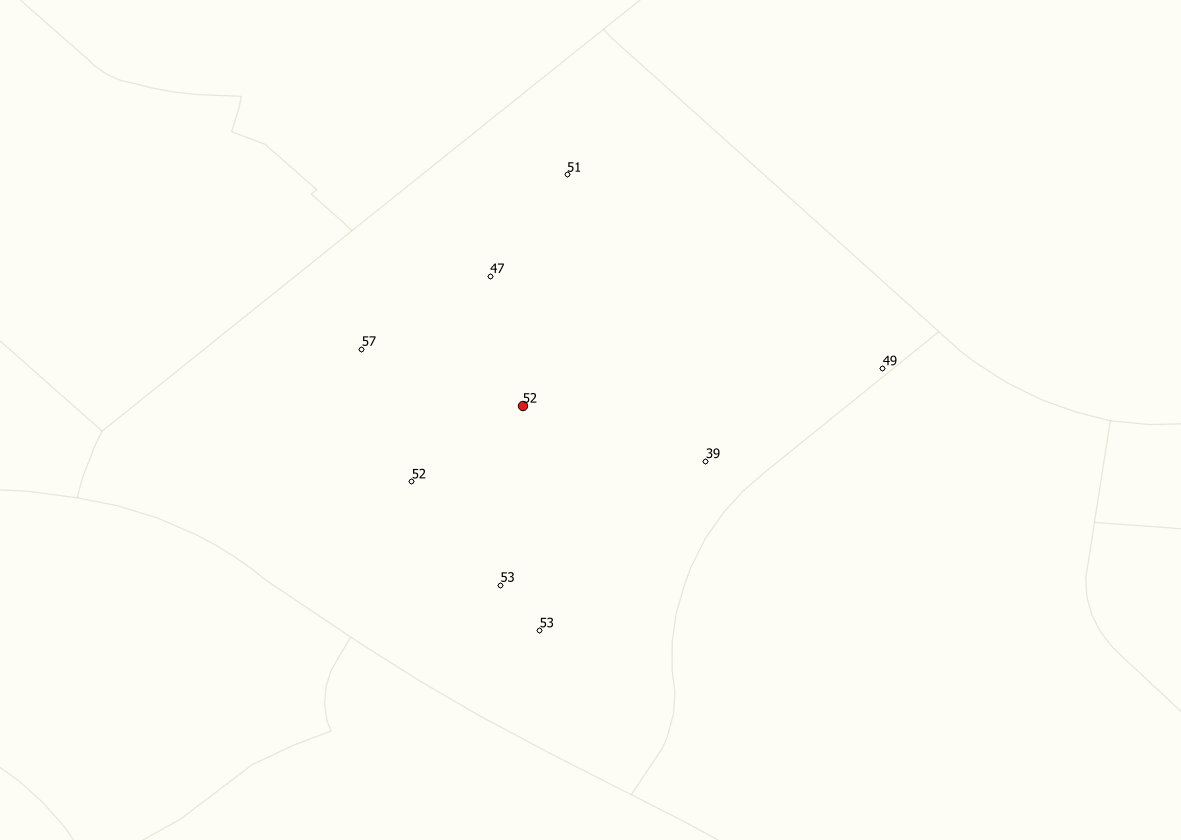
I have used the QGIS centroid function (the big red dot) and the vector/random points functions (the 8 small white dots). I have put the values next to each:

Eg: the centroid value (red) = 52 and the avg of the 8 random points anywhere in the polygon using my calculator comes to 50.13
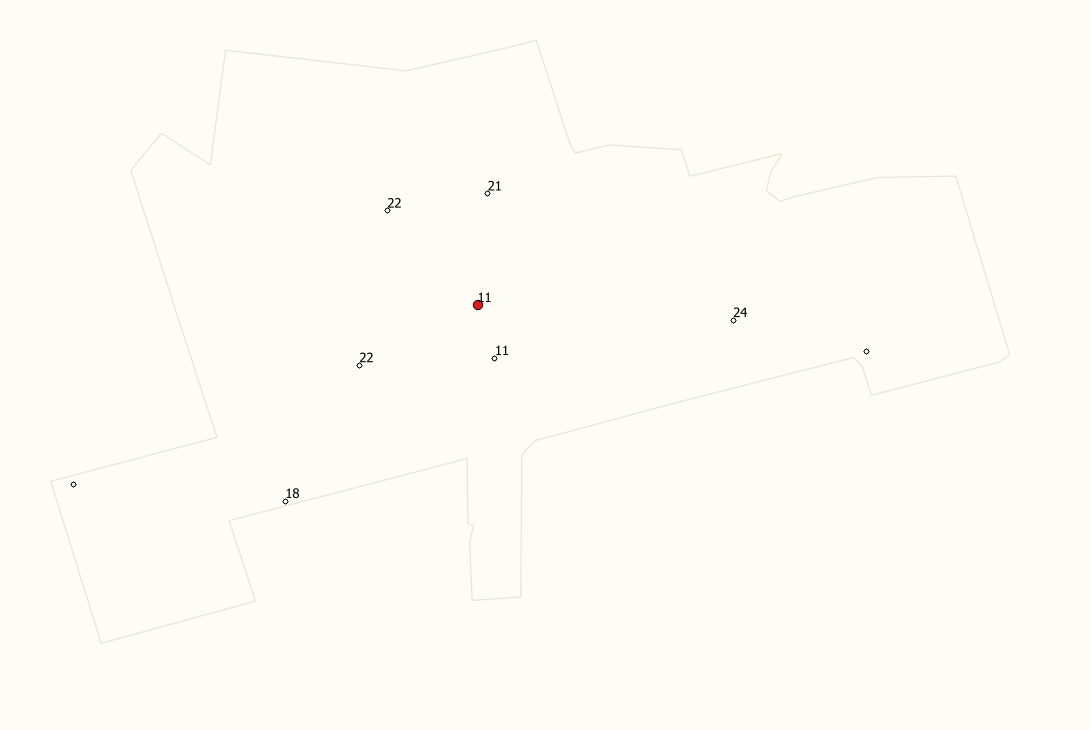
to make things a little harder, a very few of the data points are null. see below:
 The above example shows there are not always 8 'good' values. In the above example 6 of the 8 are fine, so the equation would need to 'allow' for this somehow.
So this is for just showing 2 example shape files - But there are a LOT to process
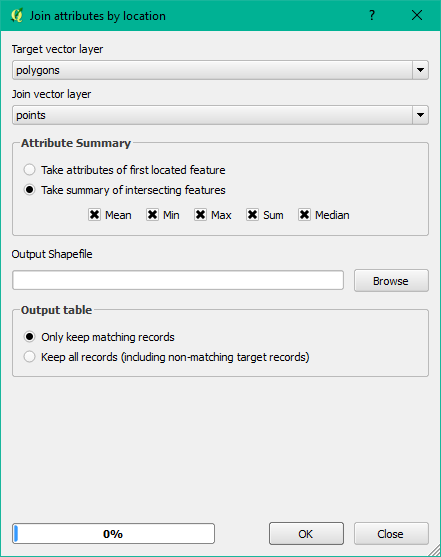
QUESTION: I have many shapes, each with their own ID. I have managed to connect each of the 8 smaller dataPoints to the shape ID successfully but how can i automatically evaluate the average of the 8 random points for EACH polygon against the value for the centroid, in a shapefile of multiple polygons?
Note: I'd like their average but maybe a max, min and spread would also be useful.
I'm using QGIS 2.6.1

