The next code only select the number 3 band (blue band) in a RGB raster and write it as blueband.tif.
from osgeo import gdal, osr
import os, struct
import numpy as np

layer = iface.activeLayer()

provider = layer.dataProvider()

path = provider.dataSourceUri()

fmttypes = {'Byte':'B', 'UInt16':'H', 'Int16':'h', 'UInt32':'I', 'Int32':'i', 'Float32':'f', 'Float64':'d'}

dataset = gdal.Open(path)

#Get projection
prj = dataset.GetProjection()

#setting number band (blue in this case)
number_band = 3

band = dataset.GetRasterBand(number_band)

geotransform = dataset.GetGeoTransform()

# Set name of output raster
if number_band == 3:
    output_file = "/home/zeito/pyqgis_data/blueband.tif"

# Create gtif file with rows and columns from parent raster
driver = gdal.GetDriverByName("GTiff")

columns, rows = (band.XSize, band.YSize)

print "rows = %d columns = %d" % (columns, rows)

BandType = gdal.GetDataTypeName(band.DataType)

print "Band Type = ", BandType

raster = []

for y in range(band.YSize):

    scanline = band.ReadRaster(0, y, band.XSize, 1, band.XSize, 1, band.DataType)
    values = struct.unpack(fmttypes[BandType] * band.XSize, scanline)
    raster.append(values)

dst_ds = driver.Create(output_file,
                       columns,
                       rows,
                       1,
                       band.DataType)

#flattened list of raster values
raster = [ item for element in raster for item in element ]

#transforming list in array
raster = np.asarray(np.reshape(raster, (rows,columns)))

##writting output raster
dst_ds.GetRasterBand(1).WriteArray( raster )

#setting extension of output raster
# top left x, w-e pixel resolution, rotation, top left y, rotation, n-s pixel resolution
dst_ds.SetGeoTransform(geotransform)

# setting spatial reference of output raster
srs = osr.SpatialReference(wkt = prj)
dst_ds.SetProjection( srs.ExportToWkt() )

#Close output raster dataset
dst_ds = None

#Close main raster dataset
dataset = None
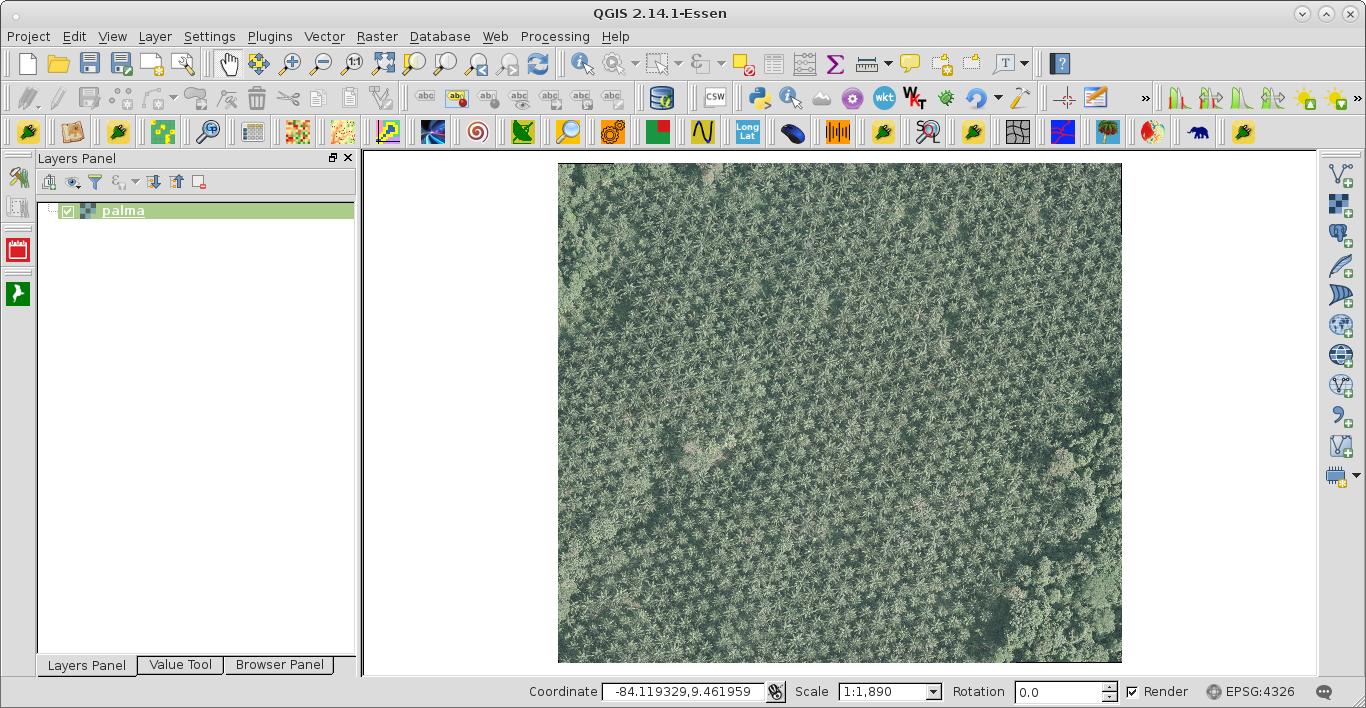
I tried out the code with the RGB raster of the next image:

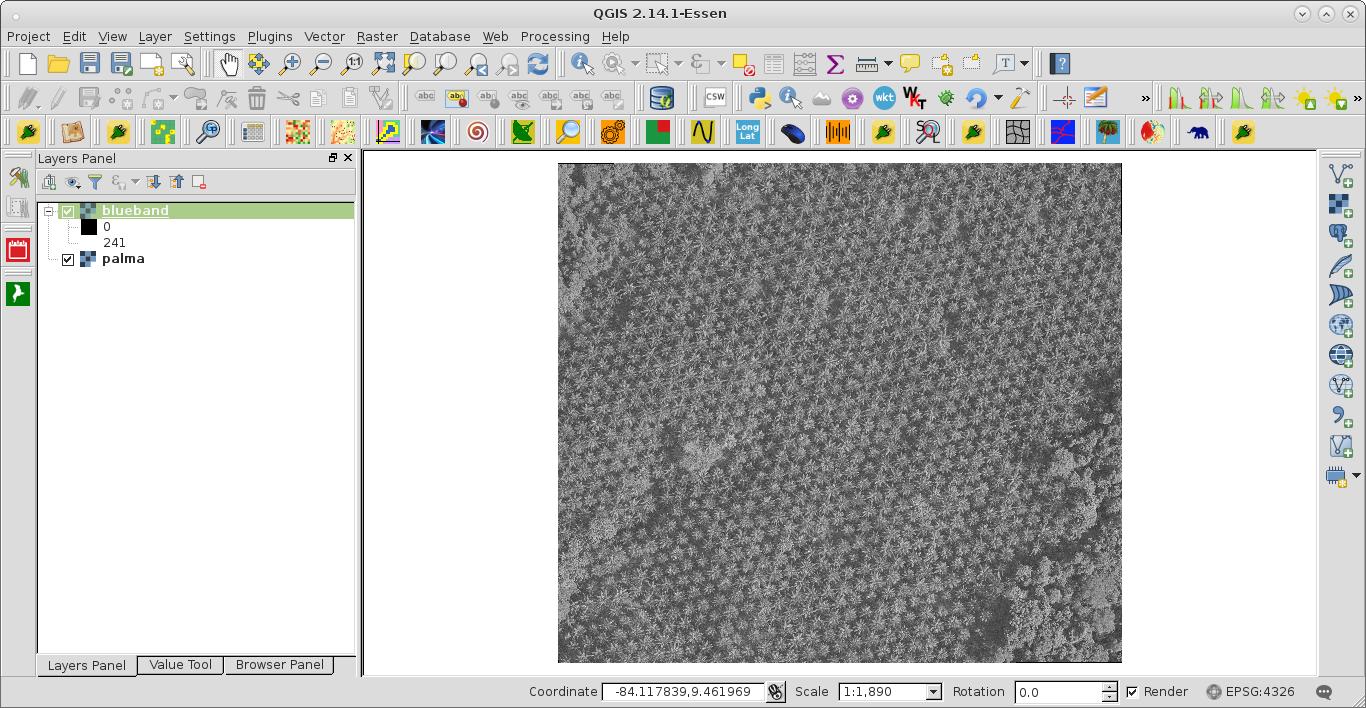
After running the code (at the Python Console of QGIS), I loaded the blue_band raster; as it can be observed at the next image:

You can adapt it for your particular purpose (customizing number bands, paths, etc).


newtif.GetRasterBand(1)will return aosgeo.gdal.Bandvs aosgeo.gdal.Datasetand not have any of the geospatial information with it.