13

I've a raster dataset in Cache/Mixed format in ArcGIS. I need to export this into a georeferenced tiff or any other raster image format in order to use it as base map in some other desktop based GIS software like QGIS.

So far, I've only found a tool in ArcGIS named Export tile cache (Data management) which can only alter the tile format to either .tpk file or exploded/compact cache format. I couldn't find any tool to convert these tiles data into any image.

If I use the export data option present in ArcGIS, the resultant image is nothing other than just a black image.

Any one knows how I can export these tiles data into an image?.


Edited

The answer given by @felixIP can be a solution, but I'm looking for another work around. The tiles have some configuration files with them as in the image below

File structure of ArcGIS server cache tiles

The conf.cdi looks like below

<?xml version="1.0" encoding="utf-8" ?>
<EnvelopeN xsi:type='typens:EnvelopeN' xmlns:xsi='http://www.w3.org/2001/XMLSchema-instance' xmlns:xs='http://www.w3.org/2001/XMLSchema' xmlns:typens='http://www.esri.com/schemas/ArcGIS/10.1'>
    <XMin>8142366.0491449088</XMin>
    <YMin>4370513.4222595459</YMin>
    <XMax>8146042.4910550155</XMax>
    <YMax>4375009.1735663339</YMax>
    <SpatialReference xsi:type='typens:ProjectedCoordinateSystem'>
        <WKT>PROJCS[&quot;WGS_1984_Web_Mercator_Auxiliary_Sphere&quot;,GEOGCS[&quot;GCS_WGS_1984&quot;,DATUM[&quot;D_WGS_1984&quot;,SPHEROID[&quot;WGS_1984&quot;,6378137.0,298.257223563]],PRIMEM[&quot;Greenwich&quot;,0.0],UNIT[&quot;Degree&quot;,0.0174532925199433]],PROJECTION[&quot;Mercator_Auxiliary_Sphere&quot;],PARAMETER[&quot;False_Easting&quot;,0.0],PARAMETER[&quot;False_Northing&quot;,0.0],PARAMETER[&quot;Central_Meridian&quot;,0.0],PARAMETER[&quot;Standard_Parallel_1&quot;,0.0],PARAMETER[&quot;Auxiliary_Sphere_Type&quot;,0.0],UNIT[&quot;Meter&quot;,1.0],AUTHORITY[&quot;EPSG&quot;,3857]]</WKT>
        <XOrigin>-20037700</XOrigin>
        <YOrigin>-30241100</YOrigin>
        <XYScale>148923141.92838538</XYScale>
        <ZOrigin>-100000</ZOrigin>
        <ZScale>10000</ZScale>
        <MOrigin>-100000</MOrigin>
        <MScale>10000</MScale>
        <XYTolerance>0.001</XYTolerance>
        <ZTolerance>0.001</ZTolerance>
        <MTolerance>0.001</MTolerance>
        <HighPrecision>true</HighPrecision>
        <WKID>102100</WKID>
        <LatestWKID>3857</LatestWKID>
    </SpatialReference>
</EnvelopeN>

While config.xml has following information

<?xml version="1.0" encoding="utf-8" ?>
<CacheInfo xsi:type='typens:CacheInfo' xmlns:xsi='http://www.w3.org/2001/XMLSchema-instance' xmlns:xs='http://www.w3.org/2001/XMLSchema' xmlns:typens='http://www.esri.com/schemas/ArcGIS/10.1'>
    <TileCacheInfo xsi:type='typens:TileCacheInfo'>
        <SpatialReference xsi:type='typens:ProjectedCoordinateSystem'>
            <WKT>PROJCS[&quot;WGS_1984_Web_Mercator_Auxiliary_Sphere&quot;,GEOGCS[&quot;GCS_WGS_1984&quot;,DATUM[&quot;D_WGS_1984&quot;,SPHEROID[&quot;WGS_1984&quot;,6378137.0,298.257223563]],PRIMEM[&quot;Greenwich&quot;,0.0],UNIT[&quot;Degree&quot;,0.0174532925199433]],PROJECTION[&quot;Mercator_Auxiliary_Sphere&quot;],PARAMETER[&quot;False_Easting&quot;,0.0],PARAMETER[&quot;False_Northing&quot;,0.0],PARAMETER[&quot;Central_Meridian&quot;,0.0],PARAMETER[&quot;Standard_Parallel_1&quot;,0.0],PARAMETER[&quot;Auxiliary_Sphere_Type&quot;,0.0],UNIT[&quot;Meter&quot;,1.0],AUTHORITY[&quot;EPSG&quot;,3857]]</WKT>
            <XOrigin>-20037700</XOrigin>
            <YOrigin>-30241100</YOrigin>
            <XYScale>148923141.92838538</XYScale>
            <ZOrigin>-100000</ZOrigin>
            <ZScale>10000</ZScale>
            <MOrigin>-100000</MOrigin>
            <MScale>10000</MScale>
            <XYTolerance>0.001</XYTolerance>
            <ZTolerance>0.001</ZTolerance>
            <MTolerance>0.001</MTolerance>
            <HighPrecision>true</HighPrecision>
            <WKID>102100</WKID>
            <LatestWKID>3857</LatestWKID>
        </SpatialReference>
        <TileOrigin xsi:type='typens:PointN'>
            <X>-20037508.342787001</X>
            <Y>20037508.342787001</Y>
        </TileOrigin>
        <TileCols>256</TileCols>
        <TileRows>256</TileRows>
        <DPI>96</DPI>
        <PreciseDPI>96</PreciseDPI>
        <LODInfos xsi:type='typens:ArrayOfLODInfo'>
            <LODInfo xsi:type='typens:LODInfo'>
                <LevelID>0</LevelID>
                <Scale>591657527.591555</Scale>
                <Resolution>156543.03392799999</Resolution>
            </LODInfo>
            <LODInfo xsi:type='typens:LODInfo'>
                <LevelID>1</LevelID>
                <Scale>295828763.79577702</Scale>
                <Resolution>78271.516963999893</Resolution>
            </LODInfo>
            <LODInfo xsi:type='typens:LODInfo'>
                <LevelID>2</LevelID>
                <Scale>147914381.89788899</Scale>
                <Resolution>39135.758482000099</Resolution>
            </LODInfo>
            <LODInfo xsi:type='typens:LODInfo'>
                <LevelID>3</LevelID>
                <Scale>73957190.948944002</Scale>
                <Resolution>19567.879240999901</Resolution>
            </LODInfo>
            <LODInfo xsi:type='typens:LODInfo'>
                <LevelID>4</LevelID>
                <Scale>36978595.474472001</Scale>
                <Resolution>9783.9396204999593</Resolution>
            </LODInfo>
            <LODInfo xsi:type='typens:LODInfo'>
                <LevelID>5</LevelID>
                <Scale>18489297.737236001</Scale>
                <Resolution>4891.9698102499797</Resolution>
            </LODInfo>
            <LODInfo xsi:type='typens:LODInfo'>
                <LevelID>6</LevelID>
                <Scale>9244648.8686180003</Scale>
                <Resolution>2445.9849051249898</Resolution>
            </LODInfo>
            <LODInfo xsi:type='typens:LODInfo'>
                <LevelID>7</LevelID>
                <Scale>4622324.4343090001</Scale>
                <Resolution>1222.9924525624899</Resolution>
            </LODInfo>
            <LODInfo xsi:type='typens:LODInfo'>
                <LevelID>8</LevelID>
                <Scale>2311162.2171550002</Scale>
                <Resolution>611.49622628138002</Resolution>
            </LODInfo>
            <LODInfo xsi:type='typens:LODInfo'>
                <LevelID>9</LevelID>
                <Scale>1155581.108577</Scale>
                <Resolution>305.74811314055802</Resolution>
            </LODInfo>
            <LODInfo xsi:type='typens:LODInfo'>
                <LevelID>10</LevelID>
                <Scale>577790.55428899999</Scale>
                <Resolution>152.874056570411</Resolution>
            </LODInfo>
            <LODInfo xsi:type='typens:LODInfo'>
                <LevelID>11</LevelID>
                <Scale>288895.27714399999</Scale>
                <Resolution>76.437028285073197</Resolution>
            </LODInfo>
            <LODInfo xsi:type='typens:LODInfo'>
                <LevelID>12</LevelID>
                <Scale>144447.638572</Scale>
                <Resolution>38.218514142536598</Resolution>
            </LODInfo>
            <LODInfo xsi:type='typens:LODInfo'>
                <LevelID>13</LevelID>
                <Scale>72223.819285999998</Scale>
                <Resolution>19.109257071268299</Resolution>
            </LODInfo>
            <LODInfo xsi:type='typens:LODInfo'>
                <LevelID>14</LevelID>
                <Scale>36111.909642999999</Scale>
                <Resolution>9.5546285356341496</Resolution>
            </LODInfo>
            <LODInfo xsi:type='typens:LODInfo'>
                <LevelID>15</LevelID>
                <Scale>18055.954822</Scale>
                <Resolution>4.7773142679493699</Resolution>
            </LODInfo>
            <LODInfo xsi:type='typens:LODInfo'>
                <LevelID>16</LevelID>
                <Scale>9027.9774109999998</Scale>
                <Resolution>2.38865713397468</Resolution>
            </LODInfo>
            <LODInfo xsi:type='typens:LODInfo'>
                <LevelID>17</LevelID>
                <Scale>4513.9887049999998</Scale>
                <Resolution>1.1943285668550501</Resolution>
            </LODInfo>
            <LODInfo xsi:type='typens:LODInfo'>
                <LevelID>18</LevelID>
                <Scale>2256.994353</Scale>
                <Resolution>0.59716428355981699</Resolution>
            </LODInfo>
            <LODInfo xsi:type='typens:LODInfo'>
                <LevelID>19</LevelID>
                <Scale>1128.4971760000001</Scale>
                <Resolution>0.29858214164761698</Resolution>
            </LODInfo>
        </LODInfos>
    </TileCacheInfo>
    <TileImageInfo xsi:type='typens:TileImageInfo'>
        <CacheTileFormat>MIXED</CacheTileFormat>
        <CompressionQuality>75</CompressionQuality>
        <Antialiasing>false</Antialiasing>
    </TileImageInfo>
    <CacheStorageInfo xsi:type='typens:CacheStorageInfo'>
        <StorageFormat>esriMapCacheStorageModeExploded</StorageFormat>
        <PacketSize>128</PacketSize>
    </CacheStorageInfo>
</CacheInfo>

And there is tiles present in _alllayers folder. Actually, there is a link between this configuration information and naming conventions of folders and files in _allayers and I'm unable to find that link, once I get the actual point, it is not a big deal to mosaic the tiles together.

5
  • Can you add it as a layer to mxd?
    – FelixIP
    Commented Apr 28, 2016 at 6:17
  • yes, definitely, in ArcMap, I can open this dataset
    – muzaffar
    Commented Apr 28, 2016 at 6:28
  • It's very basic scripting exercise. Create fishnet with small cells, make DDP from it and travel through it, exporting view to raster
    – FelixIP
    Commented Apr 28, 2016 at 6:51
  • what do you mean by DDP?
    – muzaffar
    Commented Apr 28, 2016 at 7:20
  • Data driven pages
    – FelixIP
    Commented Apr 28, 2016 at 9:28

4 Answers 4

13
+50

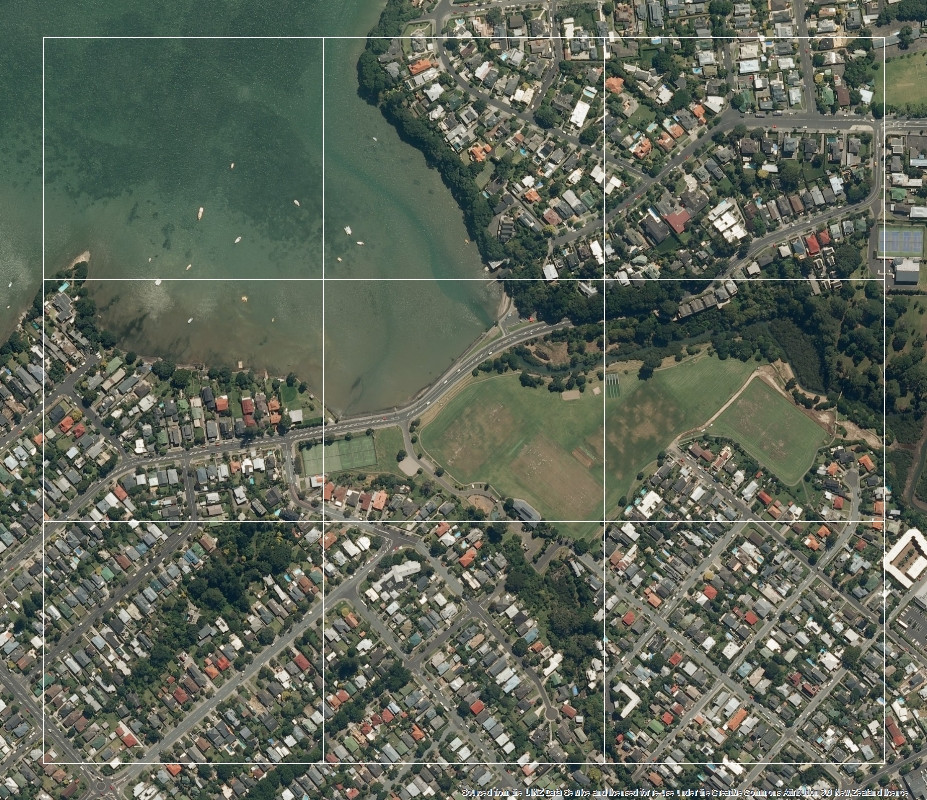
I added aerial imagery from GIS server and created fishnet over the area of interest: enter image description here

I use fishnet as index layer for my data driven pages, making sure the sorting order coincides with record order in fishnet table.

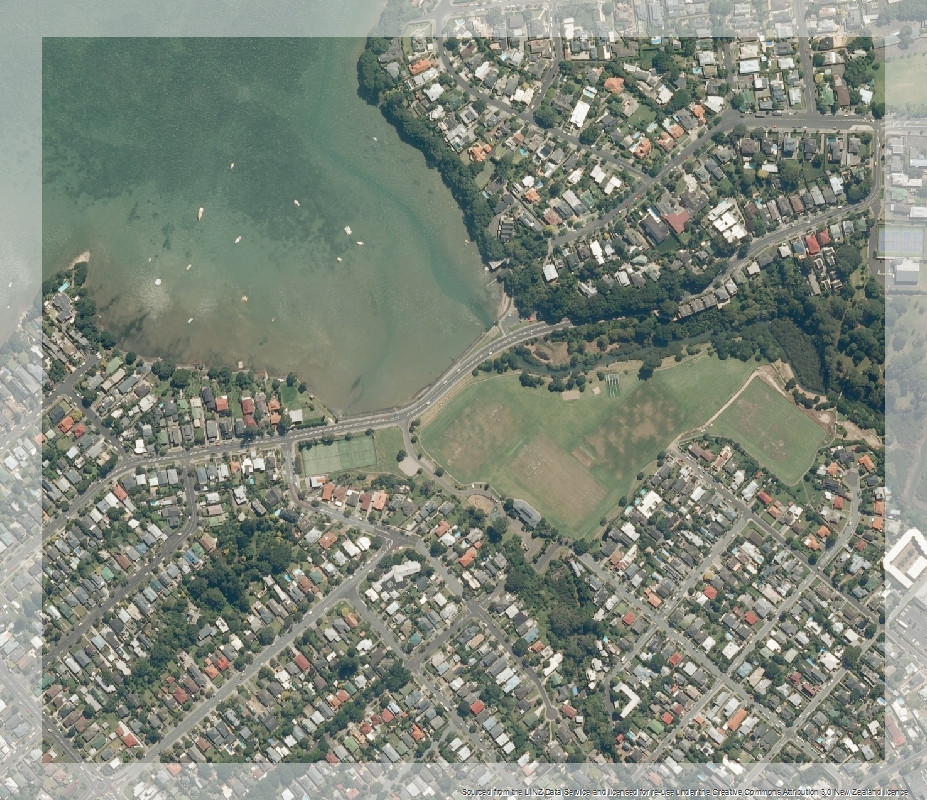
I applied script (see below) to travel through pages, export them to temp raster, clip it to PNG raster named after page name. Result shows clipped tiles with source image faded:

enter image description here

Script has 1 input parameter – output folder to save your tiles. Before running it I suggest you to play with resolution (dpi) and cell size (to get best resolution possible) of fishnet.

# EXPORT SCREENs TO RASTERs
import arcpy, traceback, os, sys, time
from arcpy import env
env.overwriteOutput = True
outFolder=arcpy.GetParameterAsText(0)
dpi=1200
tempRaster=outFolder+os.sep+"victim.png"

## ERROR HANDLING
def showPyMessage():
    arcpy.AddMessage(str(time.ctime()) + " - " + message)

try:
    mxd = arcpy.mapping.MapDocument("CURRENT")
    ddp = mxd.dataDrivenPages
    thePagesLayer = arcpy.mapping.ListLayers(mxd,ddp.indexLayer.name)[0]
#   GET RECTANGLES
    g=arcpy.Geometry()
    geometryList=arcpy.CopyFeatures_management(thePagesLayer,g)
#   EXPORT PAGES
    df = arcpy.mapping.ListDataFrames(mxd)[0]
    fld = ddp.pageNameField.name
    Page_Names=arcpy.da.TableToNumPyArray(thePagesLayer, fld)
    for pageID in range(1, ddp.pageCount+1):
        ddp.currentPageID = pageID
        arcpy.RefreshActiveView()
        time.sleep(3)
        arcpy.mapping.ExportToPNG(mxd,tempRaster,df,dpi,world_file=True)
        fName=outFolder+os.sep+Page_Names[pageID-1][0]+".png"
        anExtent=geometryList[pageID-1].extent
        envelope='%f %f %f %f' %(anExtent.XMin, anExtent.YMin, anExtent.XMax, anExtent.YMax,)
#   CLIP EXPORTED BY PAGE RECTANGLE
        arcpy.Clip_management (tempRaster, envelope,fName)
        arcpy.AddMessage('%s processed' %fName)
except:
    message = "\n*** PYTHON ERRORS *** "; showPyMessage()
    message = "Python Traceback Info: " + traceback.format_tb(sys.exc_info()[2])[0]; showPyMessage()
    message = "Python Error Info: " +  str(sys.exc_type)+ ": " + str(sys.exc_value) + "\n"; showPyMessage()

Sorting order of pages is most important. Before 'travel' starts script creates a list of rectangles/pages and uses i-th (page no -1) one to clip screenshot. If order of pages<>order of records in fishnet table, script will produce weird results if any.

Cancel script after few steps and check results. Restart if they make sense.

UPDATE May 3, 2016

It seems few people found script useful. I modified it, so that page order and field type to store page name don't matter anymore.

# EXPORTS SCREEN TO RASTER(s)
import arcpy, traceback, os, sys, time
from arcpy import env
env.overwriteOutput = True
outFolder=arcpy.GetParameterAsText(0)
env.workspace = outFolder
dpi=1200
tempRaster=outFolder+os.sep+"victim.png"
## ERROR HANDLING
def showPyMessage():
    arcpy.AddMessage(str(time.ctime()) + " - " + message)
try:
    mxd = arcpy.mapping.MapDocument("CURRENT")
    ddp = mxd.dataDrivenPages
#   GET PAGES INFO
    thePagesLayer = arcpy.mapping.ListLayers(mxd,ddp.indexLayer.name)[0]
    df = arcpy.mapping.ListDataFrames(mxd)[0]
    fld = ddp.pageNameField.name
    for pageID in range(1, ddp.pageCount+1):
        ddp.currentPageID = pageID
        arcpy.RefreshActiveView()
        time.sleep(3)
        arcpy.mapping.ExportToPNG(mxd,tempRaster,df,dpi,world_file=True)
        fName=outFolder+os.sep+str(ddp.pageRow.getValue(fld))+".png"
        rect=ddp.pageRow.getValue("Shape")
        anExtent=rect.extent
        envelope='%f %f %f %f' %(anExtent.XMin, anExtent.YMin, anExtent.XMax, anExtent.YMax,)
#   CLIP EXPORTED BY PAGE RECTANGLE
        arcpy.Clip_management (tempRaster, envelope,fName)
        arcpy.AddMessage('%s processed' %fName)
    arcpy.Delete_management(tempRaster)
except:
    message = "\n*** PYTHON ERRORS *** "; showPyMessage()
    message = "Python Traceback Info: " + traceback.format_tb(sys.exc_info()[2])[0]; showPyMessage()
    message = "Python Error Info: " +  str(sys.exc_type)+ ": " + str(sys.exc_value) + "\n"; showPyMessage()
6
  • 1
    Hi FelixIP, when I run the script, I get the following error Python Traceback Info: File "D:\thesis\M\scipt.py", line 30, in <module> fName=outFolder+os.sep+Page_Names[pageID-1][0]+".png" and the following Python Error Info: <type 'exceptions.TypeError'>: coercing to Unicode: need string or buffer, numpy.int32 found. Can you please look into this and tell me what I need to do to resolve this?
    – muzaffar
    Commented Apr 30, 2016 at 8:35
  • 1
    It fails with page name. What field are you using to store it in DDP index layer? Example please. Also name of a output folder. It seems that field is numeric. Must be string, sorry not mentioning this
    – FelixIP
    Commented Apr 30, 2016 at 9:52
  • 1
    I created a fishnet and added a filed name 'order_' in it and added values from 1 to onward in it. The values goes up to around 1900. The name of the output folder is merged_fishnet. Actually, I've created a tool and added output folder as parameter to it. Is this the right way you want me to run the script?
    – muzaffar
    Commented Apr 30, 2016 at 9:58
  • 1
    Field must be string. Create new one. Use Python str(int(!Oldfield!)).zfill(4) to populate it in field calculator
    – FelixIP
    Commented Apr 30, 2016 at 10:08
  • 2
    Upload them somewhere, I"ll have a look. Sharing email etc is against this site policy
    – FelixIP
    Commented Apr 30, 2016 at 20:30
3

I've written a python script for this. This is the initial version of the script, so it needs to add certain values manually into the script. I've mentioned that in script. Here it is

import math
from pyproj import Proj, transform

from PIL import Image
import glob, os
import sys
from os import walk
from os.path import join, getsize

#this function would convert utm coordinates to lat lng
#function taken from http://gis.stackexchange.com/questions/78838/how-to-convert-projected-coordinates-to-lat-lon-using-python
def utmToLatLng(x,y):
  inProj = Proj(init='epsg:3857')
  outProj = Proj(init='epsg:4326')

  x2,y2 = transform(inProj,outProj,x,y)
  return (x2,y2)


#this function would take lat lng and return the tile number
#function taken from http://wiki.openstreetmap.org/wiki/Slippy_map_tilenames
def deg2num(lat_deg, lon_deg, zoom):
  lat_rad = math.radians(lat_deg)
  n = 2.0 ** zoom
  xtile = int((lon_deg + 180.0) / 360.0 * n)
  ytile = int((1.0 - math.log(math.tan(lat_rad) + (1 / math.cos(lat_rad))) / math.pi) / 2.0 * n)
  return (xtile, ytile)

#this function would take a number and return it in hexa format
#taken from http://stackoverflow.com/questions/16414559/trying-to-use-hex-without-0x
def inttohexa(x):
  return format(x, 'x')


#this function would take a number and return a 9 letter word, the first letter
# would be static, should be R and C for folder and files respectivly
#this function can be improved further. Developed by muzaffar in hurry
#that's why you so see much if else in the function
def completeEightNumbers(number,letter):
  if len(number)<8:
    less_number = 8-len(number)
    if less_number==1:
      return letter+'0'+number
    elif less_number==2:
      return letter+'00'+number
    elif less_number==3:
      return letter+'000'+number
    elif less_number==4:
      return letter+'0000'+number
    elif less_number==5:
      return letter+'00000'+number
    elif less_number==6:
      return letter+'000000'+number
    elif less_number==7:
      return letter+'0000000'+number
    elif less_number==8:
      return letter+'00000000'+number
  else:
    return letter+number


#we need these four parameters
ymin = 4370513.4222595459
ymax = 4375009.1735663339
xmin = 8142366.0491449088
xmax = 8146042.4910550155

#resolution of the max zoom level
resolution = 0.59716428355981699
tile_diff = resolution * 256 #256 is the tile width


folders_name = [] #this list would contain the actual folders which have tiles inside
#storing ymax value in a variable for loop purpose only
ymax_loop = 4375009.1735663339
while (ymin < ymax_loop):#we would keep looping until the max value reach the ymin

  #xmin value would remain same while ymax_loop would change for each loop
  latlng =  utmToLatLng(xmin, ymax_loop) #sample output 36.538723, 73.144095
  tile_num =  deg2num(latlng[1], latlng[0], 18) #18 here is zoom level
  folder_name = inttohexa(tile_num[1])
  exact_folder_name = completeEightNumbers(folder_name,'R')

  #insert the folder name in list
  folders_name.append(exact_folder_name)

  #reduce the value of loop by tile_diff -- each time the loop execute
  ymax_loop = ymax_loop - tile_diff

print folders_name


file1 = "C:\Users\A\Desktop\mosaic\output.png"
file, ext = os.path.splitext(file1)
outfile = file + ".PNG"

result_width = 25*256
result_height = 30*256
result = Image.new('RGB', (result_width, result_height))

root = "C:\Users\A\Desktop\mosaic"
folders_index = 0
for single_folder in folders_name:

    print root+"\\"+single_folder
    files = glob.glob(root+"\\"+single_folder+"\\*")

    image_list = []
    files_index = 0

    for b in files:

      image_list.append(Image.open(b))

      result.paste(image_list[files_index], box=((files_index*256),(folders_index*256)))
      files_index += 1
      #print result

      #print folders_index*256  
    folders_index +=1

result.save(outfile, "PNG")
print "done"
0

You can also transform an esri exploded cache into an ogc geopackage.

Check out this https://github.com/geoadmin/geopackage-python

-1

I think you can make this raster dataset to export it into other formats like image formats (.tif,.png,.sid) and then, you can add all these images into mosaic dataset and run "manage tile cache" to use as like base map or backfill layer.

1
  • 1
    As I mentioned in the question, if I export this data set into an image, I get just a black sheet
    – muzaffar
    Commented Apr 28, 2016 at 9:47

Your Answer

By clicking “Post Your Answer”, you agree to our terms of service and acknowledge you have read our privacy policy.

Not the answer you're looking for? Browse other questions tagged or ask your own question.