I'm looking to classify regions on a map by the amount of light pollution in the area. I have the varied intensities (0 through 60) plotted using a color map, but is there anyway that instead of a spectrum of colors I can have the numerical output instead?
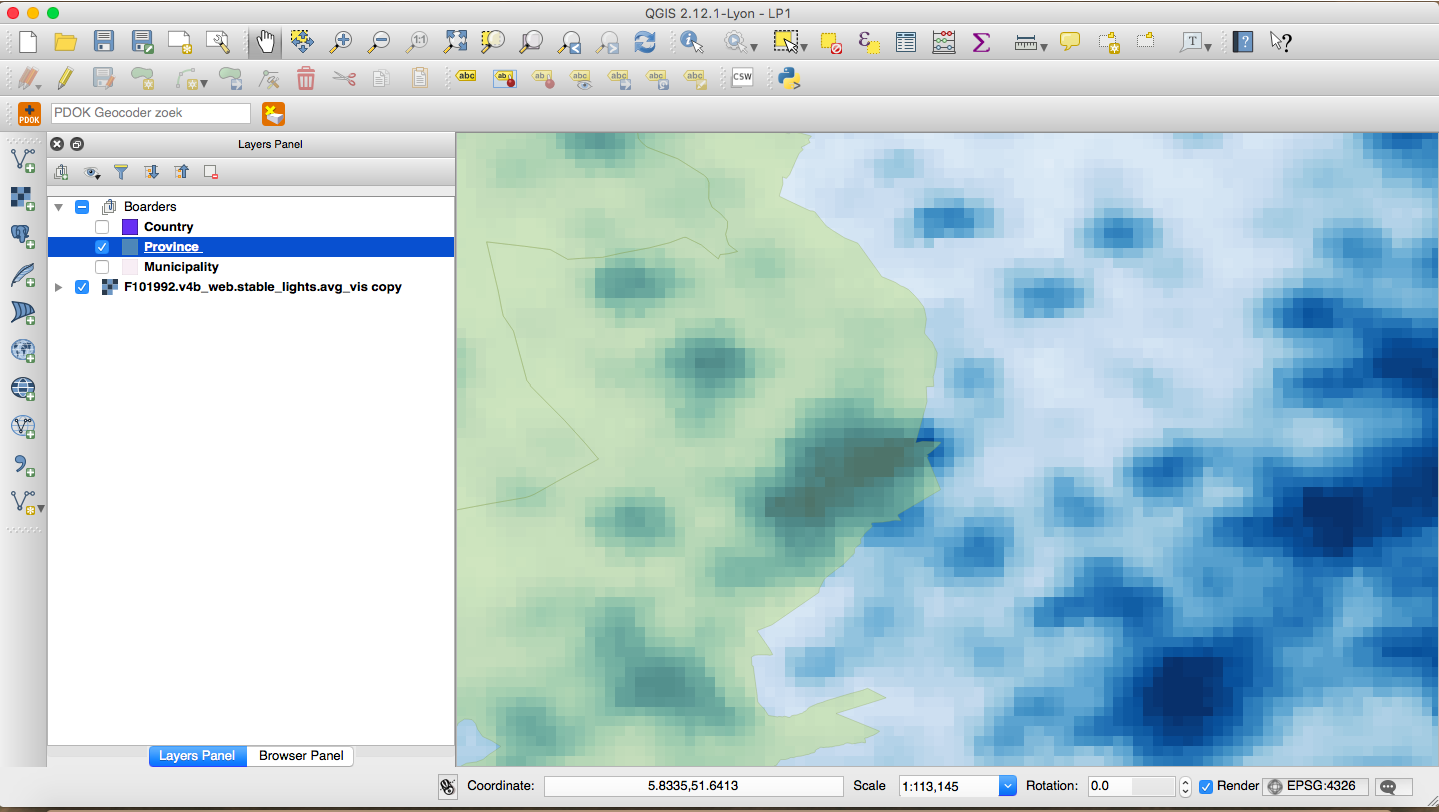
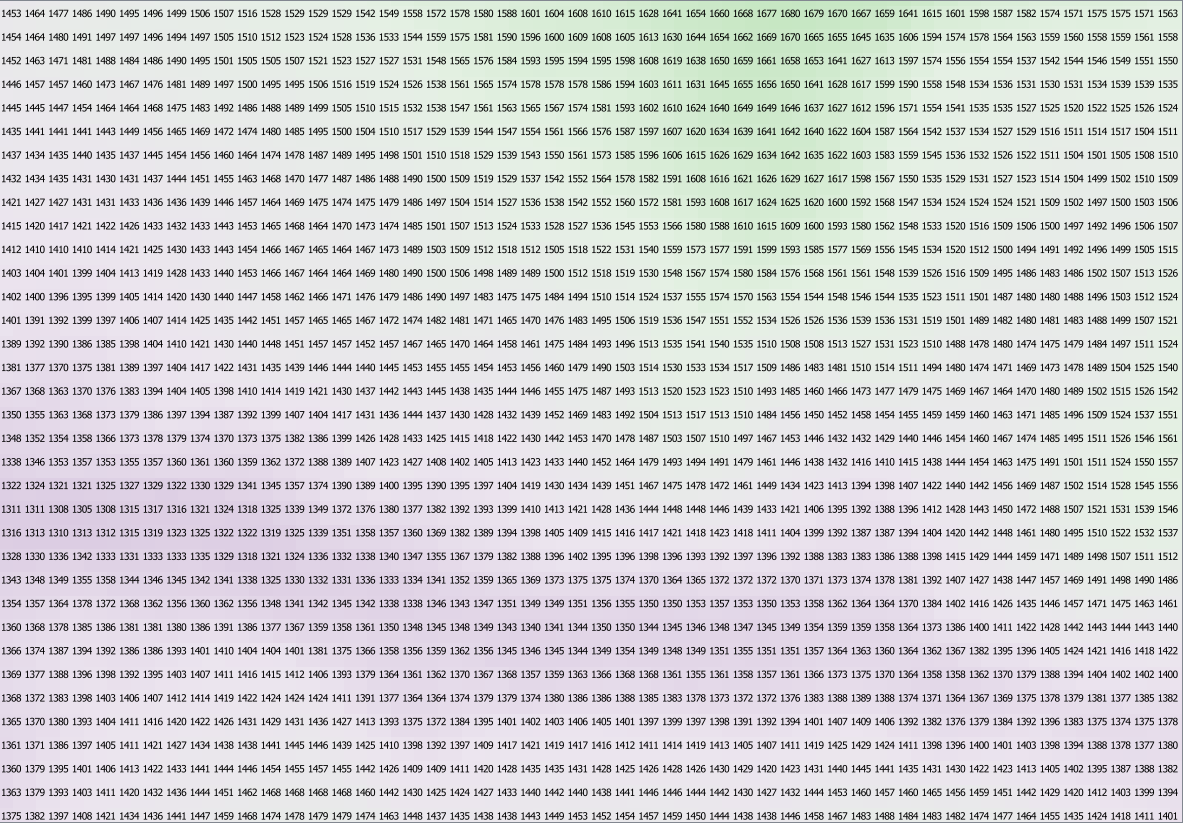
So in place of the different colors of blue as shown in the screen shot below, I would be able to see different numbers inside every pixel on the map.
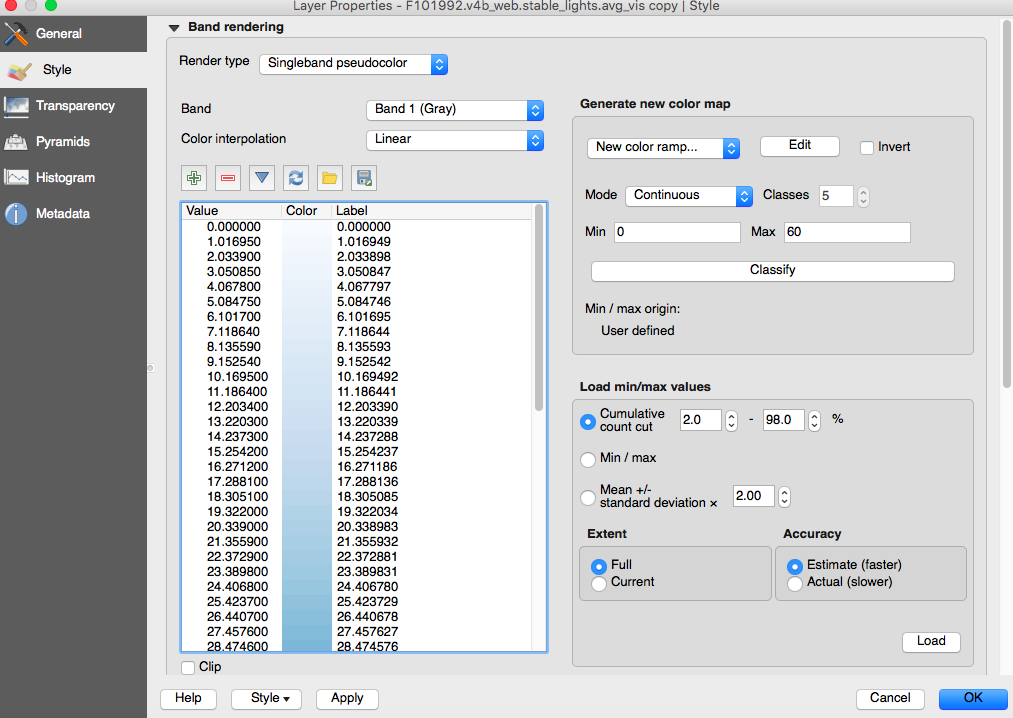
If I could even get GIS to display the 'value' or 'label' rather than the 'color' that would be everything I'm asking for.
I feel like the solution should be easy, but I'm pretty stuck.

