4

With the help from this post Lines on reprojected sp objects with Mollweide projection, I draw a world map using Mollweide projection.

I also have some points with latitudes and longitudes, and I want to put those points on the map. What should I do to add these points?

library(sp)
library(maptools)
data(wrld_simpl)
plot(spTransform(wrld_simpl, CRS = ("+proj=moll +lon_0=0 +x_0=0 +y_0=0")))
latitudes <- c(-30, 0, 20, 50)
longitudes <- c(-20, 10, 50, 80)
# how do I plot these four points on the same map?

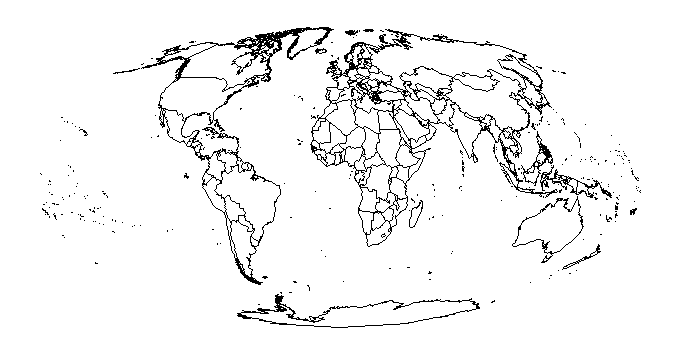
enter image description here

1 Answer 1

7

You need to make a spatial points object and then reproject that:

library(sp)
library(maptools)
data(wrld_simpl)
wrld_simpl.trans <- spTransform(wrld_simpl, CRS = ("+proj=moll +lon_0=0 +x_0=0 +y_0=0"))
plot(wrld_simpl.trans, col = 'lightgray'))
latitudes <- c(-30, 0, 20, 50)
longitudes <- c(-20, 10, 50, 80)

Make an SPDF:

pts <- data.frame(latitudes, longitudes)
coordinates(pts) <- ~longitudes+latitudes
proj4string(pts) <- CRS(paste("+init=epsg:4326"))

Project and plot it:

pts.trans <- spTransform(pts, CRS = ("+proj=moll +lon_0=0 +x_0=0 +y_0=0"))
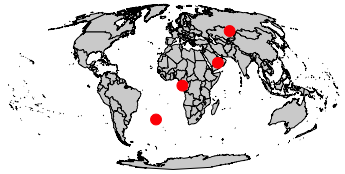
points(pts.trans, cex = 1.5, col = 'red', pch = 19)

enter image description here

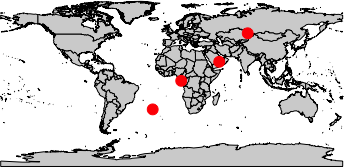
# Compare to unprojected
plot(wrld_simpl, col = 'lightgray')
points(pts, cex = 1.5, col = 'red', pch = 19)

enter image description here

EDIT: This is actually a little more fun with extreme points:

longitudes <- seq(-150, 150, length.out = 5)
latitudes <- seq(-90, 90, length.out = 5)

enter image description here

Your Answer

By clicking “Post Your Answer”, you agree to our terms of service and acknowledge you have read our privacy policy.

Not the answer you're looking for? Browse other questions tagged or ask your own question.