1

I have been working in QGIS with a large and detailed shapefile where remaining forest fragments are represented as polygons. I would like to extract circlular buffers, of various radii, from this vector layer using R. The forest fragment file and a point I need to buffer can be found here, and a radius I am interested in is 1.128km.

There seem to be ways to extract circular buffers from rasters, but not from polygon layers. Is the only way for me to perform this operation to first convert my polygon layer into raster form in GRASS, saga-gis, or GDAL?

2
  • You can do that with dismo::circles and raster::intersect. As you do not provide example data, I cannot show how. Commented Jun 16, 2016 at 18:34
  • I have added links to some forest fragments and a point I'd like to buffer above! Thanks for your suggestion, @RobertH. I would love to see how you'd script this!
    – Nematode
    Commented Jun 21, 2016 at 9:27

2 Answers 2

1

Here is an approach. Some example data:

library(dismo)
# points
n <- 10
set.seed(123)
xy <- cbind(runif(n, -150, 150), runif(n, -50,  50))
# polygons
p1 <- rbind(c(-180,-20), c(-140,55), c(10, 0), c(-140,-60), c(-180,-20))
p2 <- rbind(c(-10,0), c(140,60), c(160,0), c(140,-55), c(-10,0))
p3 <- rbind(c(-125,0), c(0,60), c(40,5), c(15,-45), c(-125,0))
p <- spPolygons(p1, p2, p3, attr=data.frame(pID = 1:3), crs="+proj=longlat +datum=WGS84")

Create circles:

cc <- geometry(circles(xy, 1000000, lonlat=TRUE, dissolve=FALSE))
cc <- SpatialPolygonsDataFrame(cc, data.frame(cid=1:n))

Intersect polygons with circles:

pc <- intersect(p, cc)

Inspect results:

plot(p, border='blue', lwd=2)
plot(cc, add=TRUE, border='red', lwd=2)
plot(pc, col='gray', add=TRUE)

P.S. with a raster you can do this:

r <- raster()
values(r) <- 1:ncell(r)
buf <- extract(r, xy, buf=100000)
1

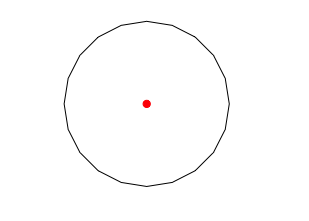
The buffer tool from the raster package lets you work with both rasters and Spatial* objects. To to create a buffer for a single point:

library(raster)
pt <- SpatialPointsDataFrame(data.frame(525000,9250000), data = data.frame('Pt1'), proj4string = CRS("+init=epsg:32736"))
pt.buf <- buffer(pt, width = 500, )

It returns a spatial polygon:

> summary(pt.buf)
Object of class SpatialPolygons
Coordinates:
      min     max
x  524500  525500
y 9249500 9250500
Is projected: TRUE 
proj4string :
[+init=epsg:32736 +proj=utm +zone=36 +south +datum=WGS84 +units=m
+no_defs +ellps=WGS84 +towgs84=0,0,0]

Plot it:

plot(pt.buf)
points(pt, pch = 19, col = 'red')

enter image description here

For more control over the output, the rgeos package gbuffer has more options. To get a buffer with more segments (e.g. 10) and a smoother curve:

library(rgeos)
pt.buf2 <- gBuffer(pt, width = 500, quadsegs = 10)
3
  • Thanks @Simbamangu ! This seems to have provided a good solution!
    – Nematode
    Commented Jun 22, 2016 at 14:34
  • Though this gets one as far as creating the buffer polygons, and not the intersection. @RobertH has provided me with an example of how to do the intersection (thanks!)
    – Nematode
    Commented Jun 22, 2016 at 16:30
  • @Nematode, you should click the √ tick mark next to RobertH's answer to mark it as answered!
    – Simbamangu
    Commented Oct 5, 2016 at 12:49

Your Answer

By clicking “Post Your Answer”, you agree to our terms of service and acknowledge you have read our privacy policy.

Not the answer you're looking for? Browse other questions tagged or ask your own question.