I ran small experiment:
- generated 900 random points
- connected them using minimum spanning tree
- picked sink somewhere in the middle
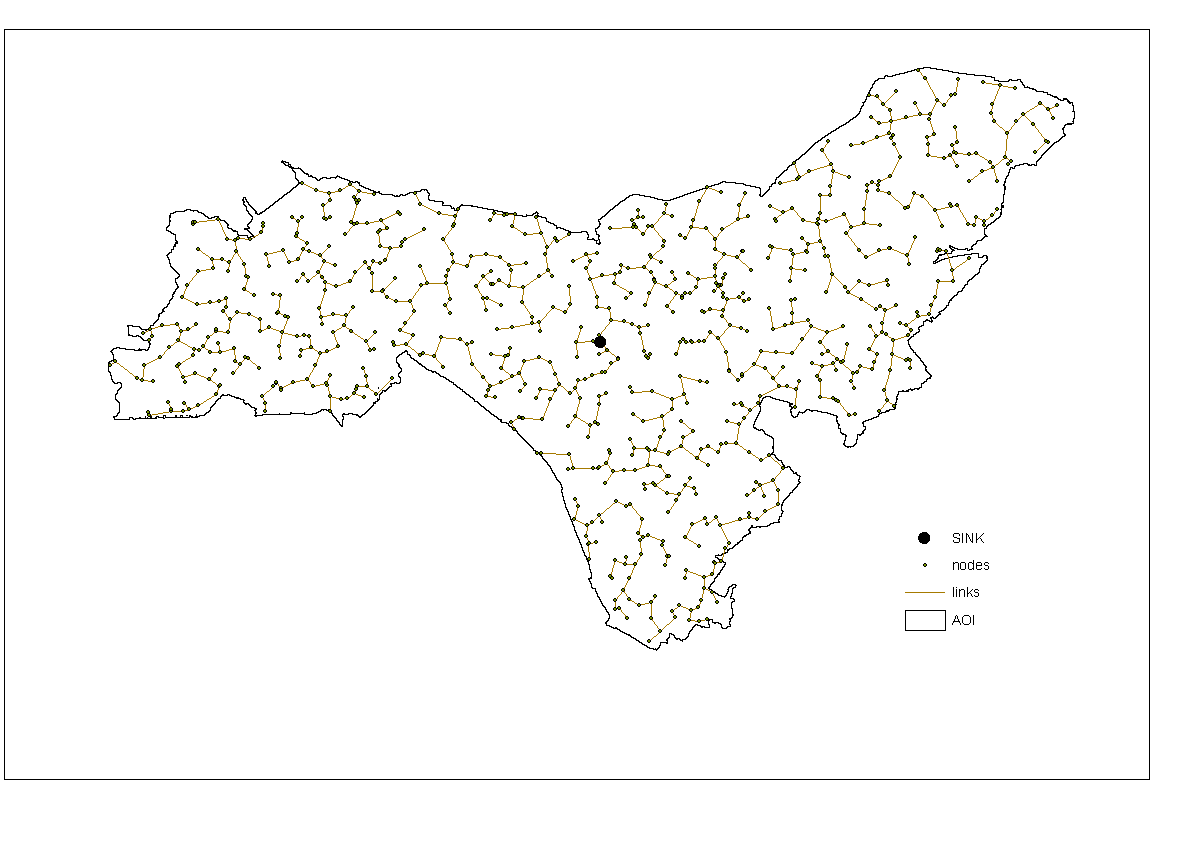
- flipped the links to form directional graph, i.e. each node
eventually discharge into same sink
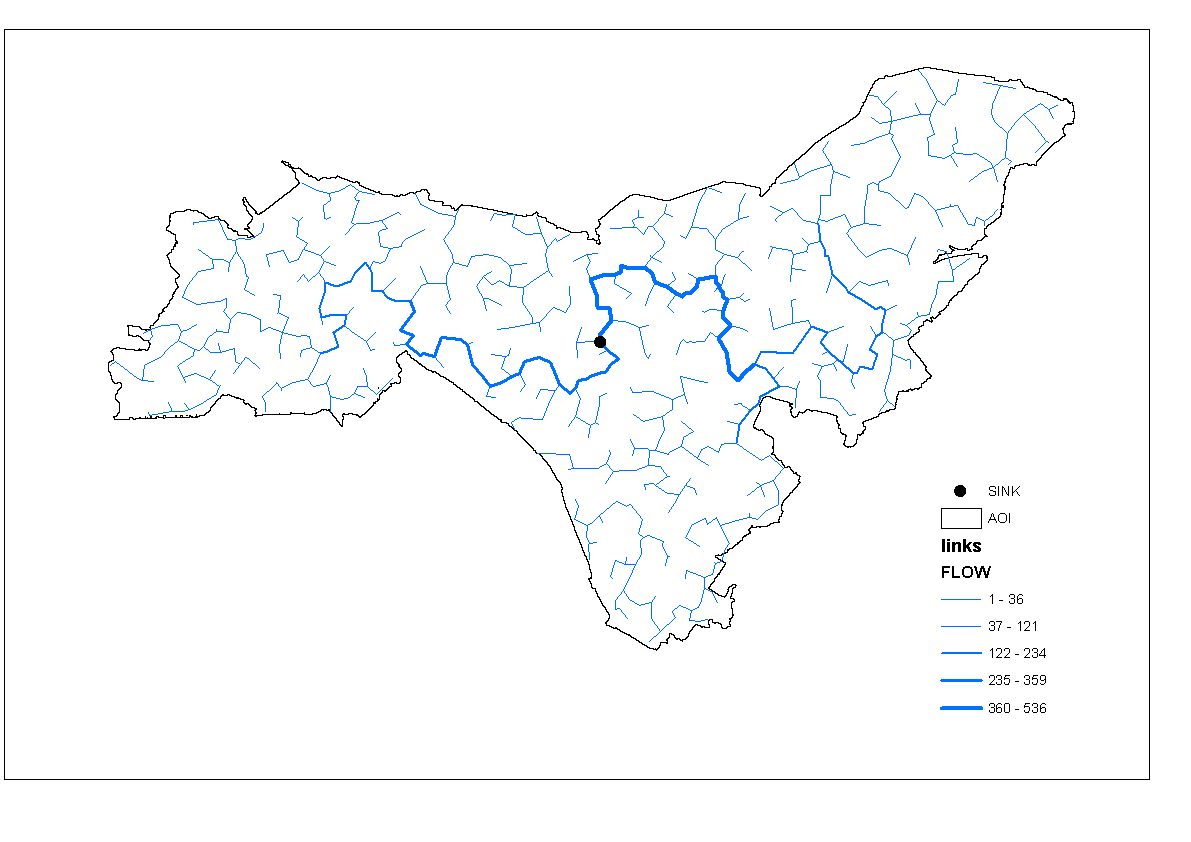
- ran script that I am using for aggregating smaller catchment into
bigger ones trying to get average "size" of 30.
RESULT:
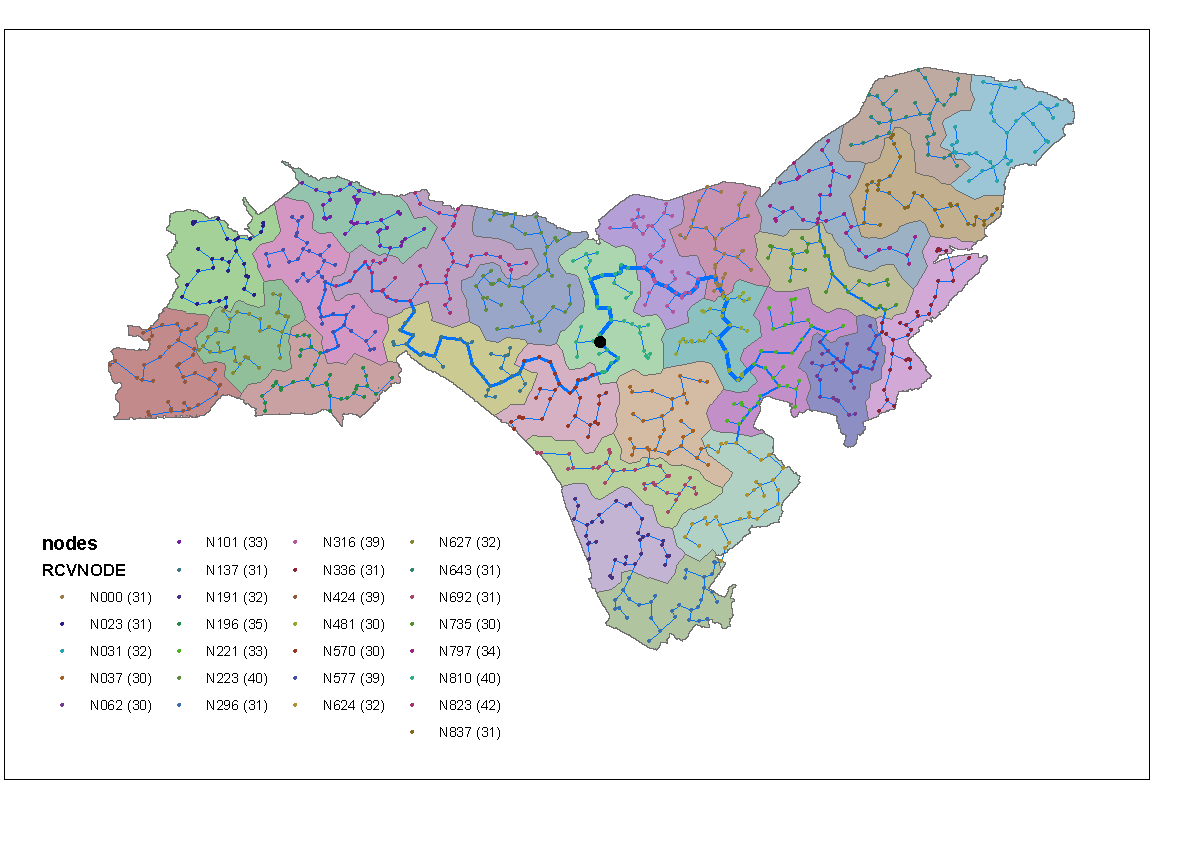
Let me know if this is of interest, I can dig up the script (it's already published somewhere on this site) or explain the workflow in more details.
I used ArcGIS.
-------------------------------------
**UPDATE Sept 2017
It is very similar to above, but using raster approach, Distance and Hydrology tools from ArcGIS. Tricky part is creation of minimum spanning tree and finding 'catchments' outlets in raster format.
These are the steps I followed:
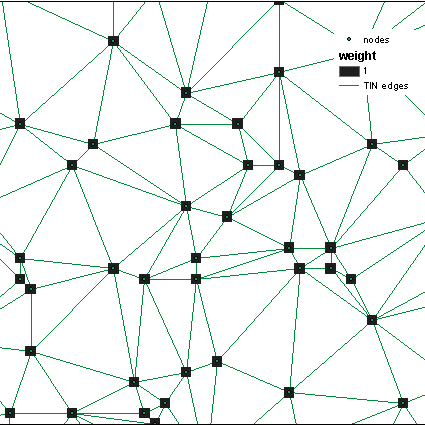
- Triangulate nodes (points to cluster), extract triangular network
edges, convert nodes to WEIGHT raster:
- Compute field in edges table: I use (ShapeLength^3/1e6). Convert to
raster, fill gaps with very high value to create COST raster.
This encourages flow between points close to each other. It is hoped that flow paths will look similar to minimum spanning tree (MST) instead of being near straight lines heading towards sink.
- Pick any node (OUTLET/SINK) and create Cost Back Link raster, using COST
surface and SINK as source. Convert back link raster to decent
Flow Direction raster using
Int(Power(2,"backlink"-1)). Accumulate
flow using flow direction and weight raster. As one can see the trick
with cost assignment truly produces something similar to MST:
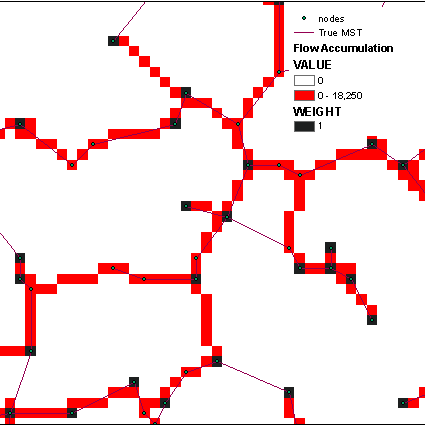
I decided to group points by 50. Keeping in mind fractal structure of network I set the limit slightly lower INLET points at the start of 'High Flow Streams', i.e. Con ("FlowAccum">45,1). Inlets defined as cells where
High Flow exists & focal statistics = 2 & cell is not an SINK (no data value in Flow Direction):
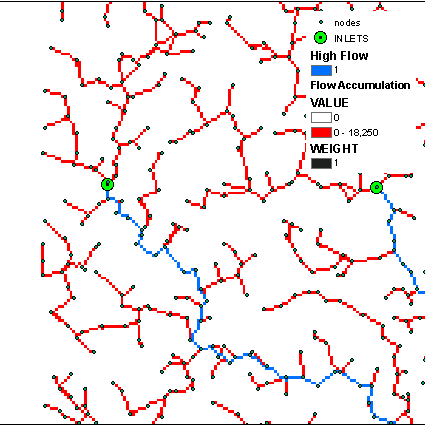
Use inlets as pour points and flow direction to define catchments. Picture shows 115 catchments derived:
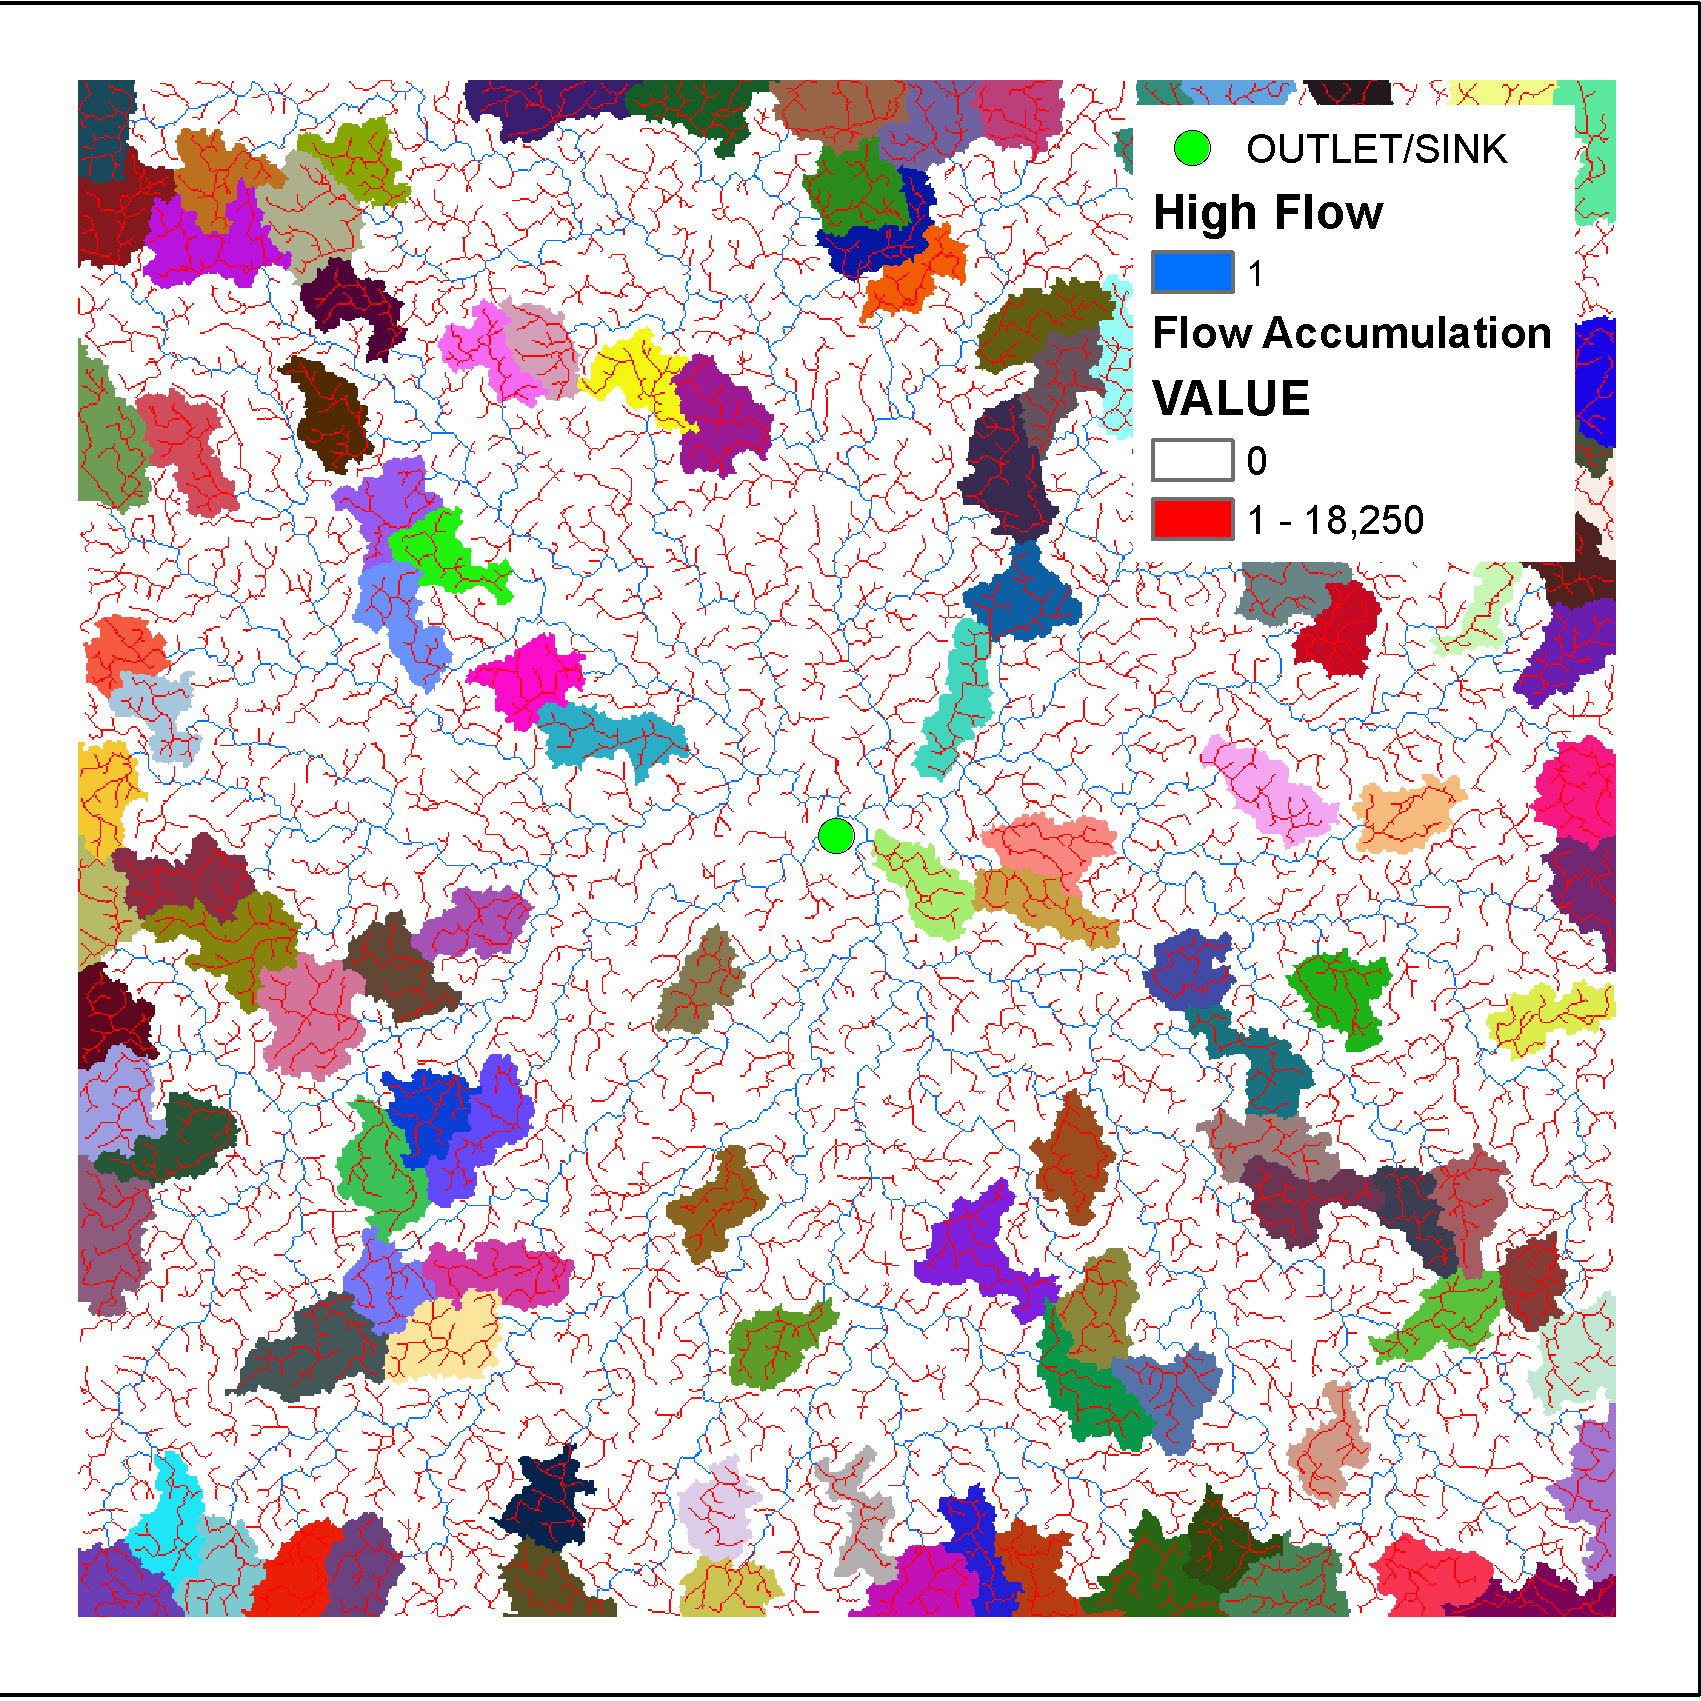
Their statistics: mean = 50.33, min = 46 and max = 74.
To obtain second set of catchments it si enough to erase WEIGHT raster under already defined catchments, calculate Flow Acuumulation etc.
Method will work for millions of points because it is raster based, triangulation of that number of points is not going to be an issue either.


