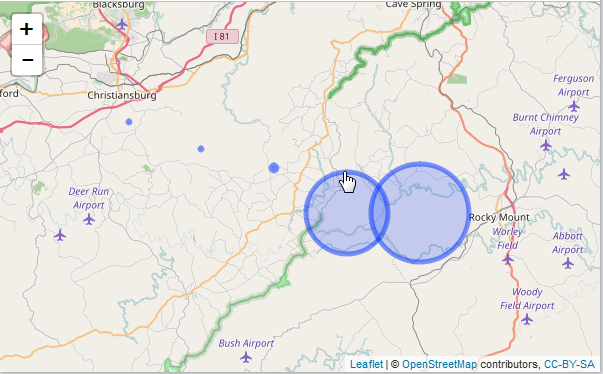
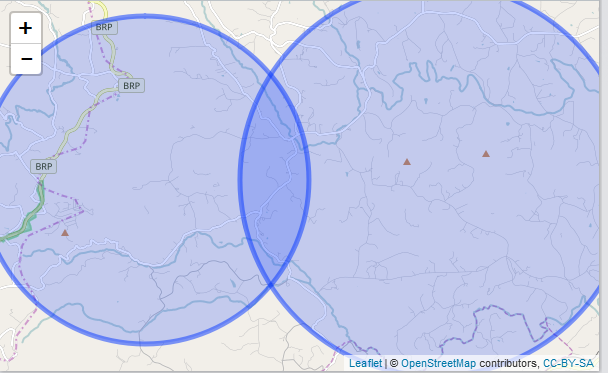
I am searching for a way to lock the size of the circle markers in Leaflet for R, addCircleMarkers(). I need the markers to retain the size they are relative to the polygon they are within upon zooming. At the moment, when you zoom, the markers stay the same size relative to your screen.
2 Answers
If I understand what you mean, you use addCircles() instead of addCircleMarkers(). Here's some (totally arbitrary) example code:
#create dummy dataframe
lon <- c(-80, -80.2, -80.4, -80.1, -80.3)
lat <- c(37, 37.05, 37.1, 37, 37.07)
num <- as.numeric(c(6000, 400, 10, 5000, 10))
x <- data.frame(lat, lon, num)

#plot with leaflet
leaflet(data = x) %>%
  addTiles() %>%
  addCircles(lat = ~lat, lng = ~lon, radius = ~num)
-
Looks like the units are meters based on this: stackoverflow.com/questions/36316222/… Commented Feb 5, 2019 at 16:56
It is important to remember the map projections.
It also depends on the projection you are using in Leaflet, it is good to check it with Leaflet's measurement tools or if you know the location well. To see the projections I recommend
crsDF <- rgdal::make_EPSG()
View(crsDF)
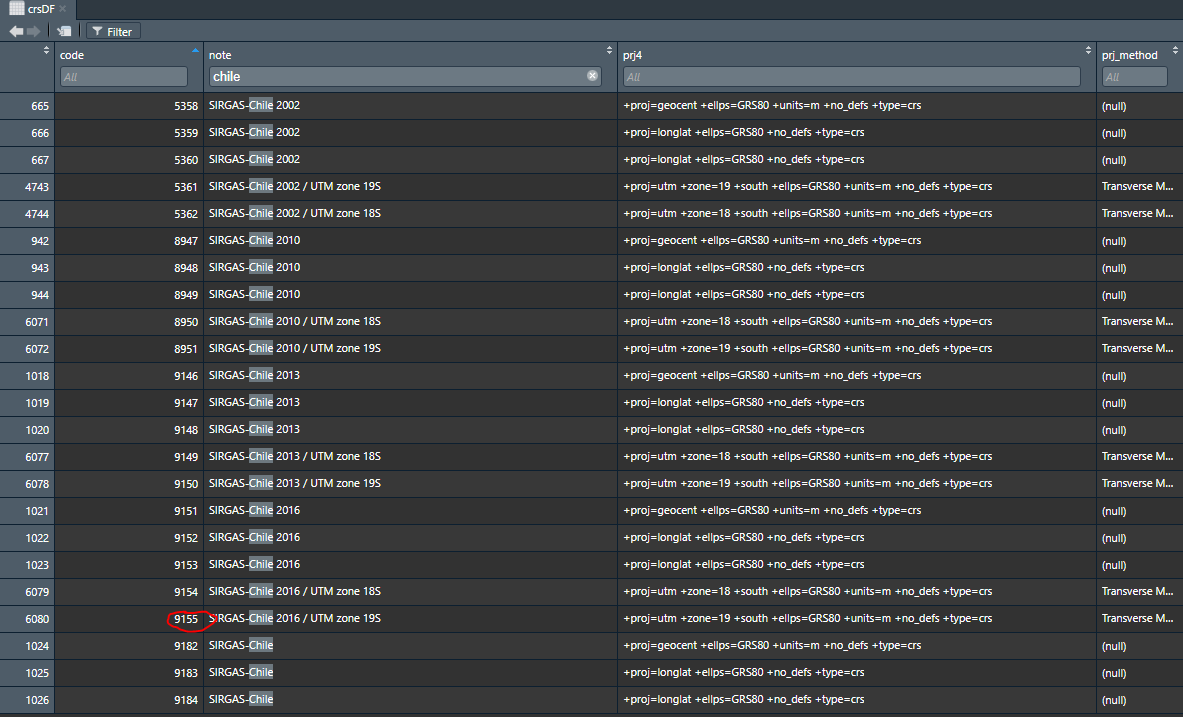
In my case, that I am in Chile (a long and narrow country) I use this projection for some places:
CRS 9155 =
"+proj=utm +zone=19 +south +ellps=GRS80 +units=m +no_defs +type=crs"
There you can see that I am using units in meters
Here I leave an image of some projections for my country.
View(crsDF)
You can find more in:
- https://geocompr.robinlovelace.net/spatial-class.html#projected-coordinate-reference-systems
- https://geocompr.robinlovelace.net/spatial-class.html#crs-in-r
Greetings


