7

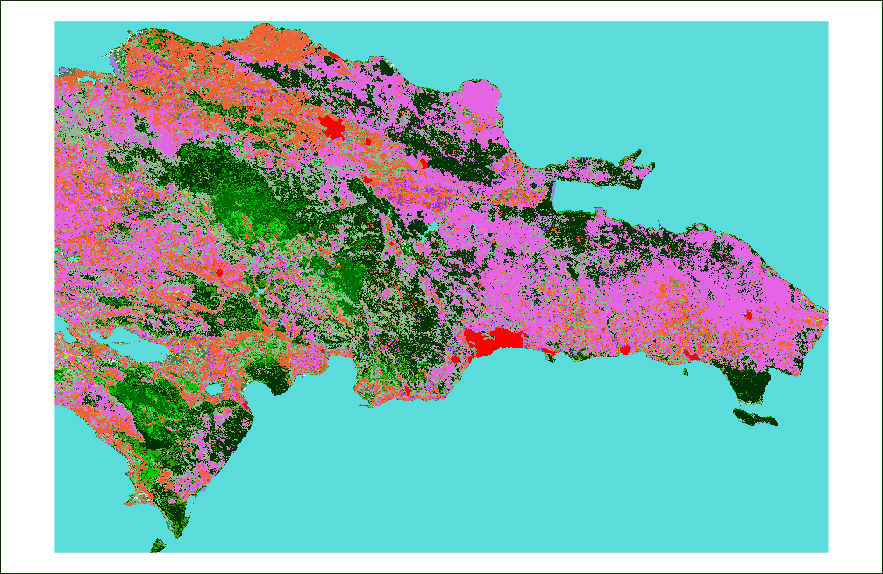
I want to export a raster as a PNG image. I don't want borders, labels, legends, axis... all I want is the map covering the whole image.

The data come from here (vegetation cover) and here (administrative boundaries).

library(raster)
library(rgdal)
r <- raster('gm_lc_v3.tif')
p <- readOGR('ne_10m_admin_0_countries','ne_10m_admin_0_countries')
i <- 66 # Dominican Republic
country <- crop(r,p[i,])
png(paste(p$GEOUNIT[i],'.png',sep=''),width=country@ncols,height=country@nrows)
par(mar=c(0,0,0,0))
plot(country,maxpixels=country@ncols*country@nrows)
dev.off()

It saves the file, but adds an undesirable margin to it. I've seen people suggesting other commands, like raster::spplot or rasterVis::levelplot. I tried spplot, but still didn't work. I don't want to install a new package to do what should (in theory?) be very simple.

country@ncols = 883 and country@nrows = 574. That's the size of the final PNG. But since the margins are being added, my image is not representing the raster correctly. I want each pixel in the raster to become a pixel in the image.

That's the image I'm getting (I added a black border to make the white margin visible).

map

2 Answers 2

3

The raster::plot function allows you to pass graphic parameters to base plot. Because of this, arguments from "par" are applicable. Please read up on help for par, which defines all of the base plotting parameters.

In your case "mar" should remove the plot margins. If you provide mar=c(0,0,0,0) as an argument in your call to plot this, hopefully, should do the trick. You may want to also play around with "mai" and "bg". You could define the background as transparent using something like bg=rgb(255,255,255,alpha=1). Since there is plot canvas overhead, I would explicitly set the height and width with units in inches or centimeters and not using the row/col dimensions of the raster.

You could also dig directly into the graphics::image and raster::image function(s). This may give you some more flexibility in omitting the background plot canvas entirely.

4
  • I'm already using that.
    – Rodrigo
    Commented Aug 18, 2016 at 18:17
  • "mar" is not changing the margins, either if called before plot (as in the code above), or as an argument for plot, as you suggested. The background should make no difference, since I don't want any pixels beyond the map. If I want my map to be X by Y pixels, why shouldn't I specify it in pixels? What do you mean with "plot canvas overhead"?
    – Rodrigo
    Commented Aug 18, 2016 at 19:23
  • I know that you are following a logical course of action, but you are misinterpreting the height and width parameters in the png function. The argument pointsize also comes into play in defining the resolution of the resulting png. It is not a straight one-to-one match between the raster and png dimensions. It should, however, be that simple. You are just wanting the raster returned in a different format. Why not just use raster or rgdal to export as a tiff? Then you will have the exact dimensions of the image. Commented Aug 18, 2016 at 19:48
  • writeRaster worked, thanks. Though I would still prefer to save them as PNG instead of TIFF. "It is not a straight one-to-one match between the raster and png dimensions" I still don't understand why. The default width and height parameters of png function is in pixels. The PNG file is created with exactly the dimensions I specified. Only the border is ruining it.
    – Rodrigo
    Commented Aug 18, 2016 at 19:57
3

Well, I had to do it in the most bizarre way I found, which was creating a 3D array, and saving it to PNG:

m <- array(NA,c(nrow(country),ncol(country),3))
m[,,1] <- matrix(strtoi(paste('0x',substr(country@legend@colortable[country@data@values+1],2,3),sep=''))/255,ncol=ncol(country),nrow=nrow(country),byrow=T)
m[,,2] <- matrix(strtoi(paste('0x',substr(country@legend@colortable[country@data@values+1],4,5),sep=''))/255,ncol=ncol(country),nrow=nrow(country),byrow=T)
m[,,3] <- matrix(strtoi(paste('0x',substr(country@legend@colortable[country@data@values+1],6,7),sep=''))/255,ncol=ncol(country),nrow=nrow(country),byrow=T)
writePNG(m,paste(p$GEOUNIT[i],'.png',sep=''))

Jeffrey Evans suggested the use of writeRaster, but that can only save a TIFF, and I wanted a PNG.

2
  • 4
    writeGDAL could have written a png but first you would have to coerce to a SpatialPixelsDataFrame object. You could even pull the colortable values and assigned to them to the @data slot. Commented Aug 18, 2016 at 22:35
  • 1
    I found Jeffery's comment helpful to solve my own case. In the OP's case, writeGDAL(as(country, Class = "SpatialPixelsDataFrame"), fname = "country.png", drivername = "PNG", type = "Byte", mvFlag = 255 would produce a png file with transparent background.
    – jazzurro
    Commented Aug 15, 2019 at 1:54

Your Answer

By clicking “Post Your Answer”, you agree to our terms of service and acknowledge you have read our privacy policy.

Not the answer you're looking for? Browse other questions tagged or ask your own question.