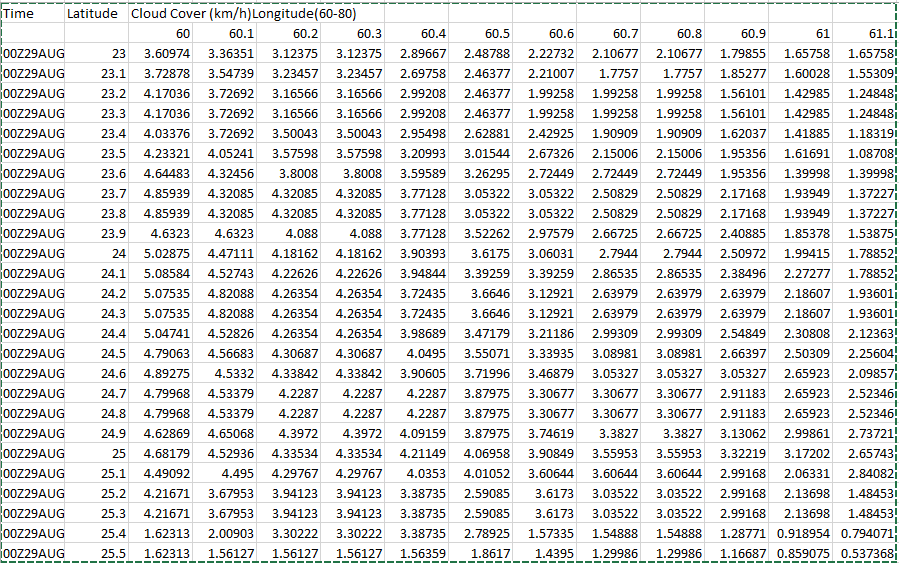
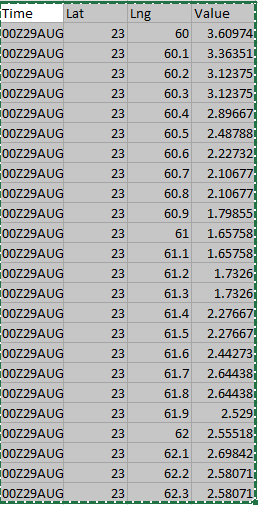
I belive the only way with an existing tool is Adding x,y coordinate data as a layer:
In addition to data sources, such as a shapefile, you can add tabular
data that contains geographic locations in the form of x,y coordinates
to your map. If the table also contains z-coordinates, such as
elevation values, you can add tabular data as 3D content into your
globe or scene
The layer can then be exported to a Feature Class.
I think you should go for a python script. Script below will read data stored in a CSV file and create Points in a Point shapefile:
import arcpy,csv
arcpy.env.overwriteOutput=1
arcpy.env.workspace = r'C:\Temp'
inputcsv=r'C:\Temp\Coordinate.csv'
outputfc = r'outshape.shp'
spatref = r'C:\Temp\SWEREF99TM.prj'

#Create empty point shapefile
arcpy.CreateFeatureclass_management(out_path=r'C:\Temp', out_name=outputfc, geometry_type='POINT', spatial_reference=spatref)
arcpy.AddField_management(outputfc, field_name='Date', field_type='Text', field_length=20)
arcpy.AddField_management(outputfc, field_name='Value', field_type='DOUBLE')

#Read coordinates from csv and insert points in shape. The data is stored as time,x,y,value in the csv
icursor=arcpy.da.InsertCursor(outputfc,['Date','SHAPE@XY','Value'])
with open(inputcsv,'rb') as csvfile:
    for row in csv.reader(csvfile):
        icursor.insertRow([row[0],(float(row[1]),float(row[2])),float(row[3])])
del icursor


