3

Using the attribute table below, I want calculate a new field using the formula (field3+field4+field5+field6)/field7. Field 7 will be always larger than the addition of fields 3 through 6, so the new field will be a number between 0 and 1. Lastly, each feature should be symbolized differently using a color ramp.

enter image description here

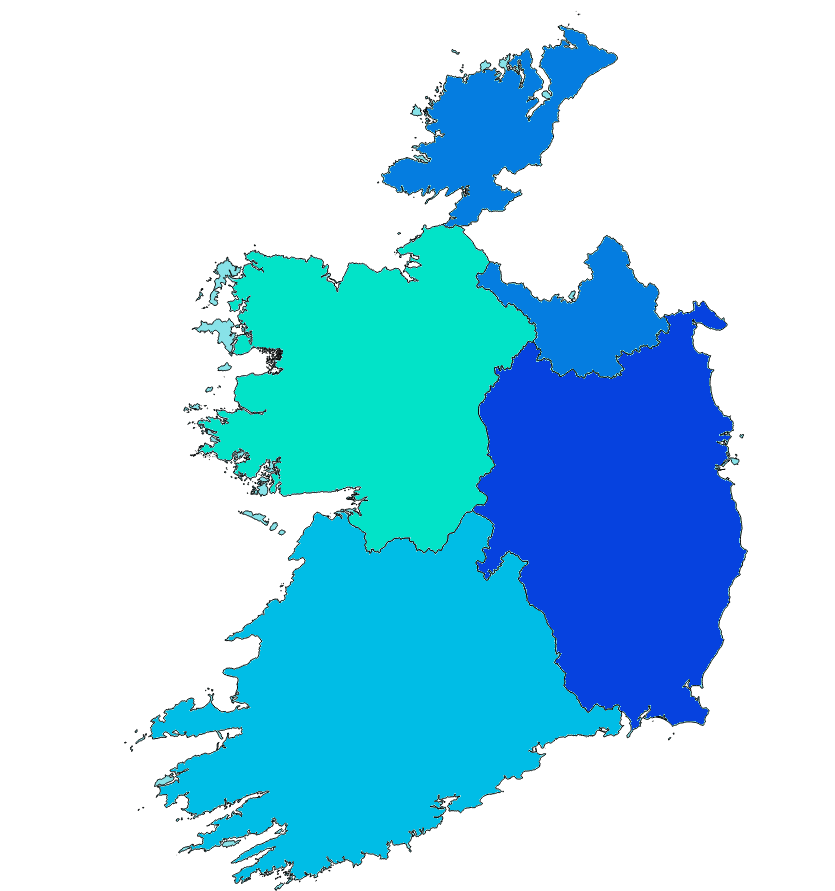
For example, leinster will have a dark blue color with a value of 0.7 and connacht will have a light blue color with a value of 0.3

Below is what I want the map to look like. The map needs to include a legend as well.

enter image description here

1 Answer 1

3

There are two ways.

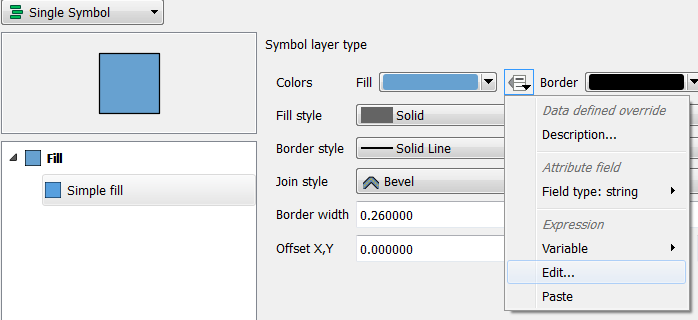
  1. Go to Layer Properties > Style enter image description here

and enter the expression: ramp_color('Spectral',"col1"+"col2"/7)

Where you should adapt the expression to fit your situation. Instead of spectral you might choose or create another color map. This won't provide you with a legend but the expression does give you more control over the coloring.

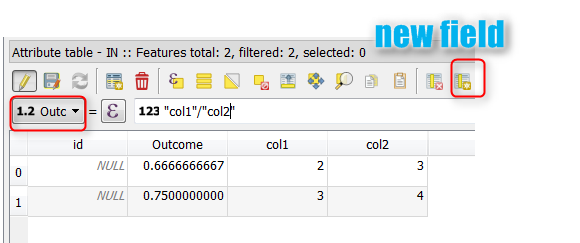
  1. Create a new (virtual) column in the attribute table and fill it with the outcome of your expression. enter image description here

Again the image is just an indication of how it works, adapt it to fit your specific use. Then go to Layer Properties > Style and select 'Categorized' or 'Graduated' with 'column' set to the column with your outcome and press 'Classify'. You will now have a color and legend entry for each value. You can select the right color map here as well.

Your Answer

By clicking “Post Your Answer”, you agree to our terms of service and acknowledge you have read our privacy policy.

Not the answer you're looking for? Browse other questions tagged or ask your own question.