7

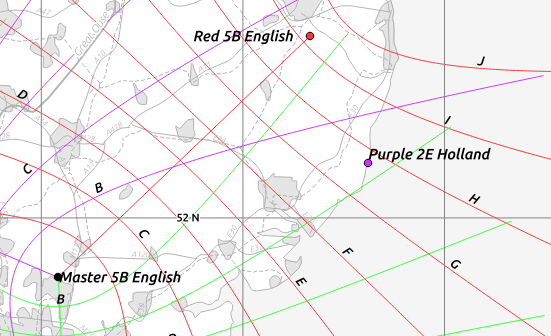
I am trying to create a GeoJSON path containing lines of hyperbola, in order to recreate Decca Navigator charts in QGIS, something like this:

Decca Navigator demonstration chart

The chart has nine lines of hyperbola plotted between each master-slave pair of radio beacons labelled B to J, where the beacons are the focus points.

I've written a C++ program which parses the location of the radio beacons, and attempts to construct the lines of hyperbola as a series of GeoJSON lines, but my maths is wrong and the lines are drawn in the wrong place:

My effort at recreating the Decca demo chart

(The red line labelled J should be between the Master and Red beacons, not beyond Red.)

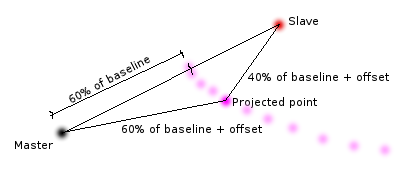
My approach to construct the lines is to plot a series of triangles, where two corners are the radio beacons, and the sides are a ratio of the baseline distance plus an offset. For instance the line labelled G crosses the baseline at 60% of the distance from the master to the slave.

enter image description here

for (auto line = 0; line < 10; line++) {
  std::vector<coord> pts;
  for (auto pt = -150; pt < 150; pt++) {
    if (pt != 0)
      pts.emplace_back(
          findHyperbolaPoint(masterCoords, slaveCoords, line * 0.1, abs(pt) * pt * -0.00005));
  }
  deccaLines.emplace_back(linestring(pts));
}

The findHyperbolaPoint performs these steps using handrolled spherical geometry functions:

  1. Find arclength between Master and Slave
  2. Calculate bearing from Master to Slave
  3. Define the arclength of Projected from Master and from Slave
  4. Calculate angle between Slave-Master-Projected and hence, the bearing from Master to Projected
  5. Find the coordinates of Projected by travelling the Master-Projected arclength along that bearing

Evidently something is going wrong at step 5 as the projected point is drawn too far from Master:

coord ptFromBearingArc(coord origin, double bearing_rad, double dist_rad) {
  double lat, lon;
  lat = asin(sin(origin.lat) * cos(dist_rad) +
             cos(origin.lat) * sin(dist_rad) * cos(bearing_rad));
  lon = origin.lon + atan2(sin(bearing_rad) * sin(dist_rad) * cos(origin.lat),
                           cos(dist_rad) - sin(origin.lat) * sin(lat));
  return {lat, lon};
}

The formulas appear to be correct but evidently I've gone wrong somewhere. Update: this was due to a simple typo in a function. Which wouldn't have occurred if I'd used a library.

Does my approach look sensible? Are better approaches available for plotting hyperbolae in QGIS?

Are there straightforward lightweight C++ library for spherical geometry calculations and/or WGS84 calculations?

1
  • Is your code available as qgis plugin? I am looking for the german chain 3F which is not supported in the dutch navy software package
    – Hans Erren
    Commented May 15, 2019 at 21:46

2 Answers 2

2

I see several options:

  1. have a look at the decca application of the dutch navy https://www.defensie.nl/downloads/applicaties/2018/04/25/decca-setup

  2. Check if your coordinates of the transmitters does not contain a typo

ENGLISH CHAIN 5B 

LOCATION    DESIGNATION FREQ    COORDINATES

Puckeridge, England     Master  85.000   kHz    51.817° N,  00.083° E

Norwich (aka Shotisham), England    Red 113.333 kHz 52.550° N,  01.333° E

Lewes, Sussex (aka East Hoathley), England  Green   127.500 kHz 50.917° N,  00.150° E

Warwick (aka Wormleighton), England Purple  70.833   kHz    52.200° N,  01.367° W

http://www.jproc.ca/hyperbolic/decca_chains.html

I also notice that your red F0 line, which is straight, must be positioned exactly halfway between the master and slave transmitter, which currently is not the case on your image, so it looks like a scaling issue. the red F0 line on my nautical map of the southern North Sea is running just south of Clacton, yours is in Felixtowe.

As for your library question Charles Karney has created a c++ library that can do calculations on an ellipsoid.

"Abstract

GeographicLib is a small set of C++ classes for performing conversions between geographic, UTM, UPS, MGRS, geocentric, and local cartesian coordinates, for gravity (e.g., EGM2008), geoid height and geomagnetic field (e.g., WMM2015) calculations, and for solving geodesic problems. The emphasis is on returning accurate results with errors close to round-off (about 5–15 nanometers). Accurate algorithms for Geodesics on an ellipsoid of revolution and Transverse Mercator projection have been developed for this library. The functionality of the library can be accessed from user code, from the Utility programs provided, or via the Implementations in other languages. Also included is a .NET wrapper library NETGeographicLib which exposes the functionality to .NET applications. For a sample of the geodesic capabilities in JavaScript, check out the online geodesic calculator and the script for displaying geodesics in Google Maps

This library is not a general purpose projection library nor does it perform datum conversions; instead use proj.4. On the other hand, it does provide the core functionality offered by GEOTRANS."

1

A detailed math is given in this publication from Delft University

Title Computation of the Decca pattern for the Netherlands Delta works

Author van der Schaaf, H.P. Vetterli, P.

Project Deltawerken

Date 1960

Abstract This report deals with two aspects of the problem of fixing the co-ordinates of points situated on lines which together form the idealized mathematical position pattern, resulting from the erection of the Decca transmitters in the Netherlands for the Delta works. Firstly, the basis and the derivation of the formulae used are discussed; and secondly, attention is given to the sequence of calculations and the way in which they are carried out, with the help of the electronic computer known as Stantec-Zebra. Decca patterns on sea-charts - involving much greater areas than covered by the Delta chain - are always calculated directly in geographical co-ordinates on the ellipsoid and mapped in respect of the network of parallels and meridians appearing on such charts; by this means any desired degree of calculating accuracy can be obtained, although great accuracy is usually not required for the purpose contemplated. For mapping purposes - and thus also for the Delta chain - it is desirable, also in view of the possibilities of comparison with conventional terrestrial position fixing, to make the Decca calculations in rectangular co-ordinates; for the Delta chain these should of course be the rectangular co-ordinates on the stereographic map projection used in land triangulation (R.D.co-ordinates). Direct conversion of geographical co-ordinates of a number of points on Decca lines into rectangular R.D. co-ordinates leads to formulae which are difficult to handle. It is for this reason that the indirect method making use of flat hyperbolae has been followed for the Delta chain, as described in this study; it leads to simple formulae which are very suitable for working out with the help of an electronic computer. When, as a result of the accuracy of drawing and the map scale used, the differences between Decca lines and flat hyperbolae are sufficiently small, the flat hyperbolic pattern is justified and the map pattern is then constructed from confocal flat hyperbolae. This pattern is discussed in Chapter 3 and can be considered as the approximated pattern for the more accurate Decca pattern. By using fairly simple formulae, based on the distances between a point on the approximated pattern and Master, Slave and the central point situated in Amersfoort, plus several pattern constants and a map projection constant, the approximated pattern is corrected point by point and the Decca pattern is thus obtained. Fig. 8 gives a survey of the size of these corrections, which makes it clear that the corrections should be taken into account for the map scales which are fixed at 1 : 5000 and 1 : 10.000. However, the problem was whether the pattern to be mapped could not be the flat hyperbolic pattern, so that corrections for map projection could also be included in the correction graph given in Chapter 6; by means of this graph decometer readings are corrected for variations occurring in the uniform propagation speeds of the radio waves which are used in the mathematical pattern. In order to make sure that deviations from the mathematical pattern which occured in practice are attributed only to physical conditions concerning the pattern actually emitted and to the inaccuracy of the reading devices and not to neglecting the map projection, this solution was not chosen. The investigation of such deviations is consequently simplified. In addition, the fact that the Decca lines should preferably connect with the accurate map content of the land area is also an argument for preferring the Decca pattern to the approximated pattern.

Link: https://repository.tudelft.nl/islandora/object/uuid:3b63581a-7a42-4ef0-b0b8-0615d2356908?collection=research

Download pdf: https://repository.tudelft.nl/islandora/object/uuid:3b63581a-7a42-4ef0-b0b8-0615d2356908/datastream/OBJ/download

Your Answer

By clicking “Post Your Answer”, you agree to our terms of service and acknowledge you have read our privacy policy.

Not the answer you're looking for? Browse other questions tagged or ask your own question.