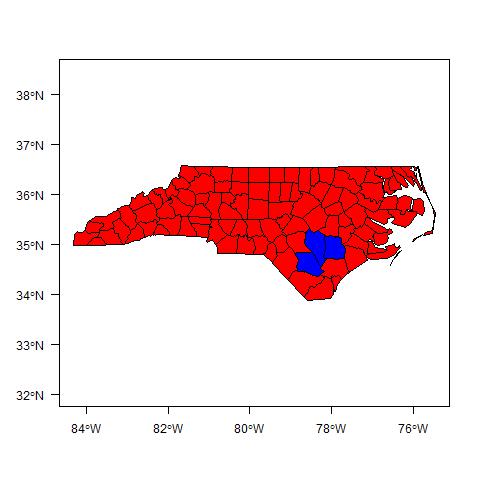
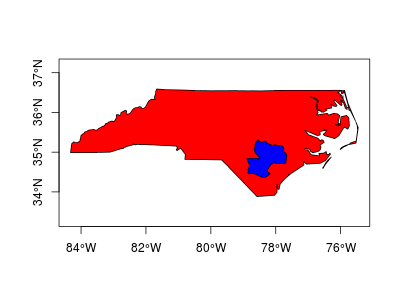
I'm plotting a shapefile in R and would like to delete certain borders to "group" shapes together. For example, in the plot below, how would I delete the borders between the three blue counties and between the red counties?
library(maptools)

xx <- readShapePoly(system.file("shapes/sids.shp", package="maptools")[1],
 IDvar="FIPSNO", proj4string=CRS("+proj=longlat +ellps=clrk66"))

COLS <- rep(2,100)

COLS[c(9,31,82)] <- 4

plot(xx, axes=TRUE, las=1, col=COLS)


