3

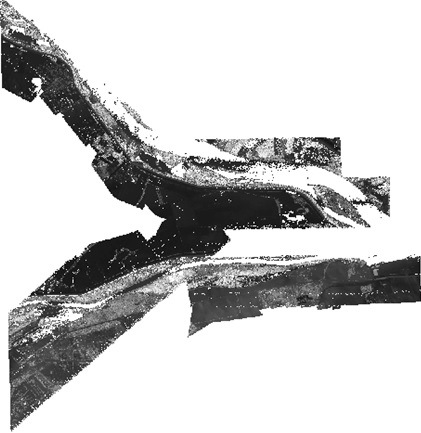
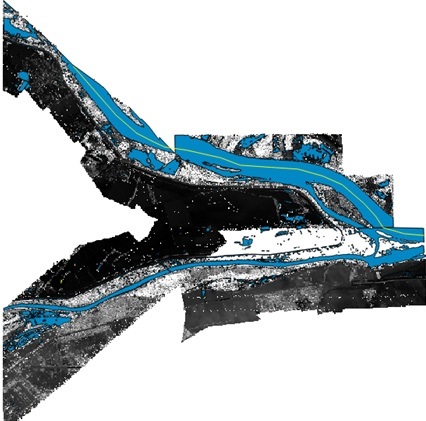
I am analyzing orthoimage and LiDAR dataset to find out flood areas. I extracted water areas as vector polygon from orthoimage using multiresolution segmentation in eCognition, and generated DTM (1.5 spatial resolution) from LiDAR dataset using moving planes algorithm in OPALS.

Extracted water areas

DTM of study site

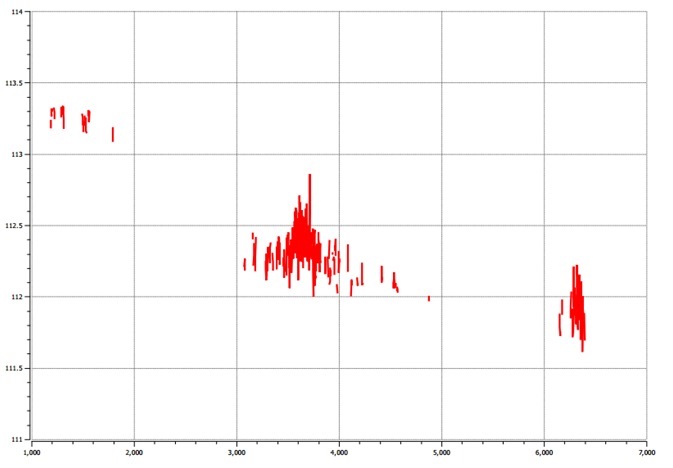
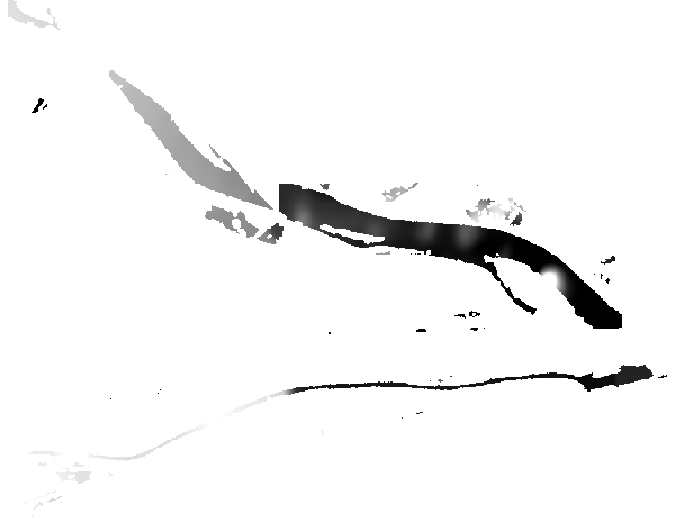
Now I am going to extract elevation of water surface areas from DTM and attach to corresponding water features by zonal statistics and also build cross section profile of water surface. One of the drawback of this work is DTM has a lot of big gaps in water areas due to very poor LiDAR returns on water surface.

I am using zonal statistics and cross-section profiles for flood analysis, but getting poor result because of many holes on the water surface in DTM. The profile line was taken from the upper left to the lower right (see the yellow line on the last map).

Cross section profile

Cross section profile line

I tried to interpolate the DTM, but the methods I used interpolate the surface using also the cells of coasts of river resulting false elevation on water surface. I extracted only water areas on DTM and want to interpolate it within overlapping water polygon, so I would get nicer zonal statistics and smoother cross-section profile. Does anybody know the method or tool to do it?

4
  • Out of curiosity, what kind of terrain is your study area comprised of? Is it coastal or inland? Is it tidally influenced? Are your water polygons connected areas or discrete ponds/lakes. Are you working in an area of the world where you can get access to other hydrology data?
    – Priscilla
    Commented Jan 27, 2017 at 18:58
  • @Priscilla, thanks for response. Study area comprised of urban, agricultural, forest and river Danube. I am analyzing coastal areas as mainly those areas are flooded. There are two main water bodies of river and several flood areas along that river. Unfortunately I don't have access to other hydrological data.
    – Sher
    Commented Jan 28, 2017 at 17:13
  • @Andre Silva, thanks for interest. As I have extracted the water features from orthophoto, now I need to take the height information from DTM and attach to corresponding water bodies using zonal statistics. I am not interested in water depth as you have mentioned (it would be very good but I think it is not possible from the data I have). Shortly, I need to extract the water areas and its surface height (not from the depth) and represent by zonal statistics and cross section profile. Please consider that I tried to improve my question above. Hope I could explain.
    – Sher
    Commented Feb 6, 2017 at 10:56
  • Thanks for the interest. x - distance and y - elevation in meters. Profile line was taken from the upper left to the lower right, please see the yellow line on the last map of the question section.
    – Sher
    Commented Feb 6, 2017 at 11:41

1 Answer 1

2

I used Diffuse Interpolation with Barriers too from ArcGIS, which is an interpolation method that can account for barriers within the study area. It can also use different cost surfaces to modify the interpolation (diffusion) process to more accurately model the phenomenon of interest.

Firstly, I converted the raster dataset (DTM) into vector points using Raster to Point tool in ArcGIS 10.2, value (height) of the each cell was attached to corresponding vector point as an attribute data. Then the gaps on the surface was interpolated (Kernel interpolation) using the water areas (vector polygon) as a barrier for the interpolation, so that only cells within the water areas were employed. As a result, I got smoothed DTM of water area without gaps.

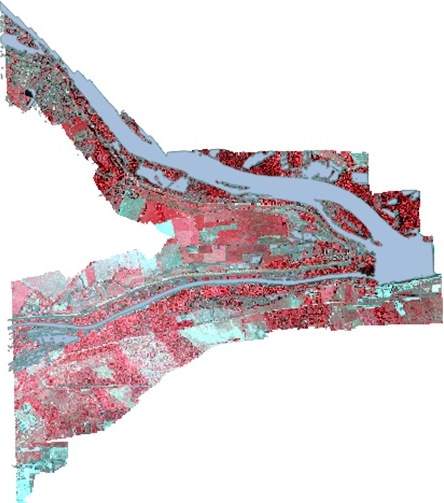
enter image description here

DTM after Diffuse Interpolation with Barriers.

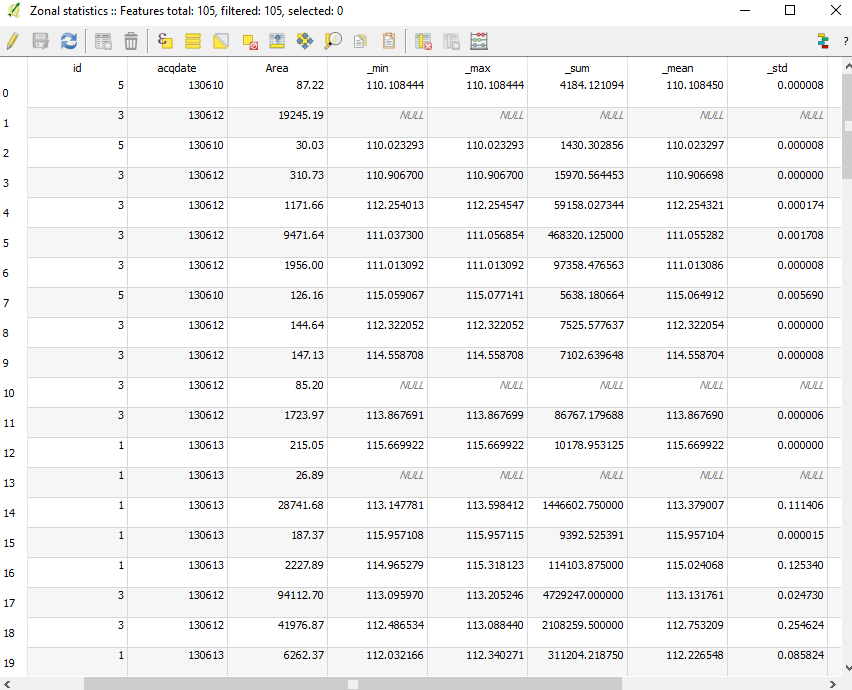
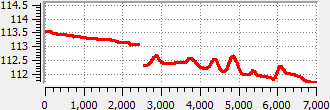
The DTM was used to calculate Zonal statistics with promising maximum, minimum and standard deviation values for each water polygon and also it was used to create very well smoothed cross section profile.

enter image description here

Zonal statistics of the sample study area.

enter image description here

Cross-section profile of the upper part of the river from upper left to right direction.

Your Answer

By clicking “Post Your Answer”, you agree to our terms of service and acknowledge you have read our privacy policy.

Not the answer you're looking for? Browse other questions tagged or ask your own question.