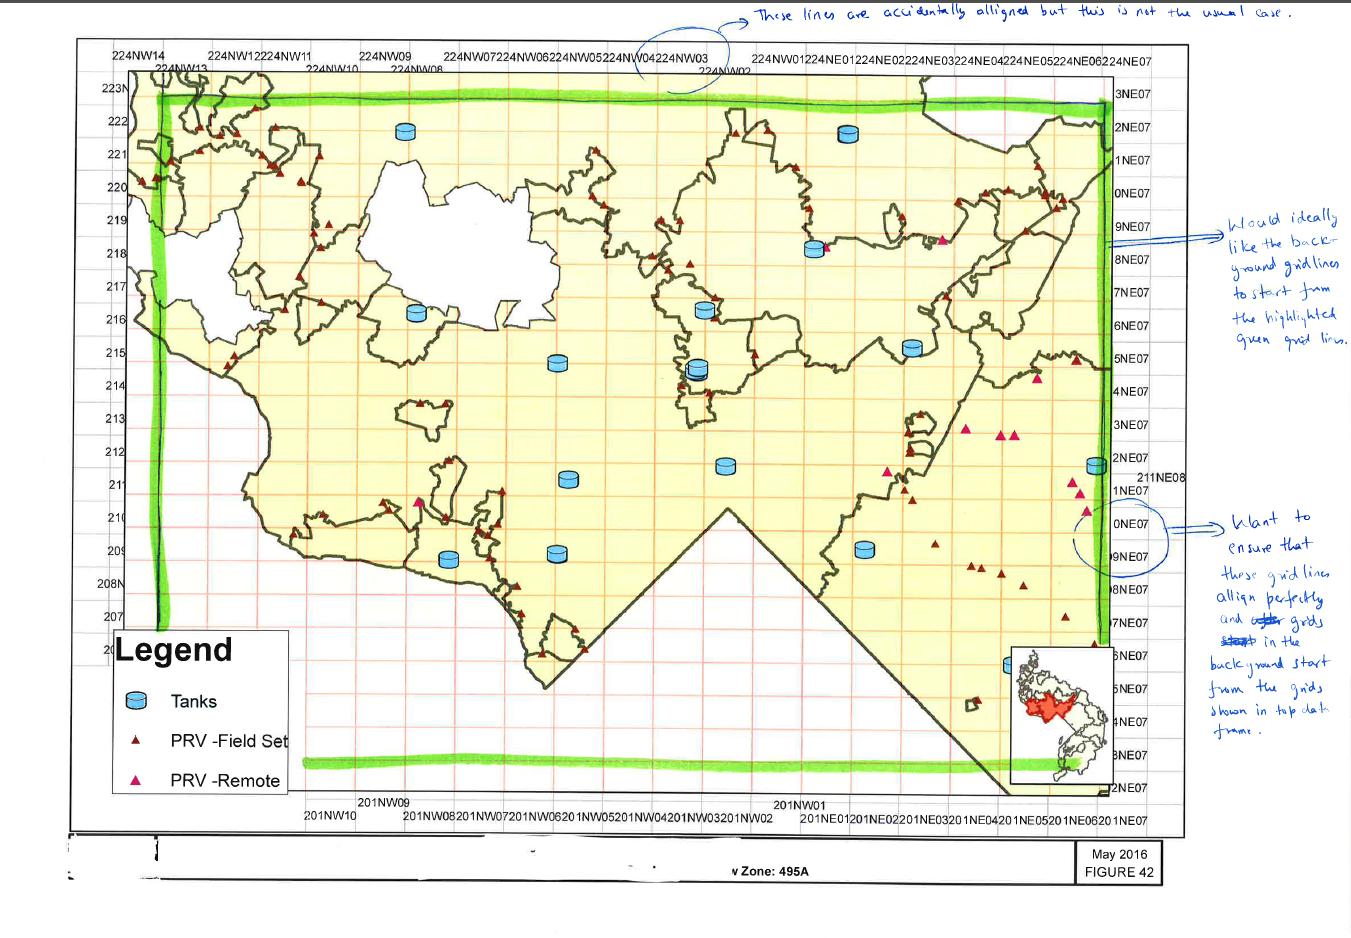
I have a dataframe which is using data-driven attribute (say zone). Now this layer has grids with specific numbering but since it is data driven, each time the zone changes, the grid numbering will change as well. To make it easier for the user to see the grid numbers, i created another dataframe with just the grid numbers and tried to put it behind my original map. But, i am not able to make them align with one another perfectly such that the grids match between both the dataframes. I have tried setting the extent of the background dataframe to be based on the original dataframe's extent (100%) but it doesn't help as the sizes of 2 dataframes don't match. I am creating a mapbook with 100's of maps and would like to set it to match the grids automatically for each zone. I am attaching the sample image for easy reference of the question.
-
I think you could use a different approach. You could make a fishnet specified to the grid you're using as a feature class, copy it in your table of contents so the fishnet layer is displayed twice, use one layer as the visual grids and the other for the labels. Have you're zones driving the DDP use a label conflict value higher than your fishnet and create a visual margin in DDP large enough so the labels fall outside of the data you're displaying.– geoJshaunCommented Jan 25, 2017 at 17:11
-
Hi ShanO, thanks for your suggestion. I do not want any grid information to be displayed inside the green highlighted lines and the zone lies further inside and is displayed in red in the inset image. Would the fishnet approach work here? I have never tried this so just wondering.– Sudhir PathakCommented Jan 25, 2017 at 18:56
1 Answer
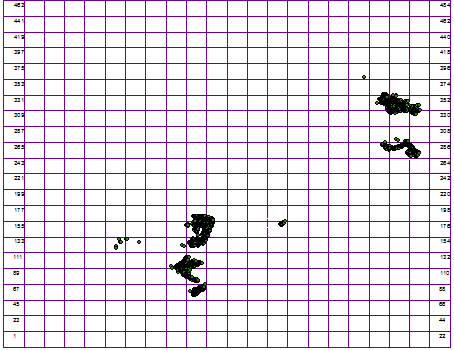
Make DDP extents creating polygons for each time zone that are 10% or whatever brings the data you want to display within the green lines. For each of these polygons, create a fishnet (Data Management, Feature Class, Create Fishnet) make a field in each fishnet populated with the timezone name or ID and the outside grid values. Choose to create label points and number of rows and columns corresponding to your current grid number of rows and columns. Once the fishnet is created select the points in the outer rows and columns. Populate these with the time zone name or ID. Enable DDP with your extent polygons and make a DDP defenition query in your fishnet to match time zone name for label points. Make grid label values for these points and change the symbology to nothing so the points don't appear but your labels do. Here's a an example pic:
It'll take a bit of work and data manipulation but you should be able to pull it off.


