My data set contains radar plots for flights on approach to an airport. For each unique flight I have hundreds of points as they are recorded every four seconds. Using Points2One I can join the points to form individual flight lines for each unique flight. In using Points2One by its nature it only creates a single line and a single record entry in the attribute table hence I'm loosing the data granularity of altitude and speed at each four second segment of the flight. Is there a way that I can create a single flight path that is composed of individual line segments, where each individual line segement would have the same record identifier (Operation No) and attrbutes as either the starting or ending point node of that line segement.
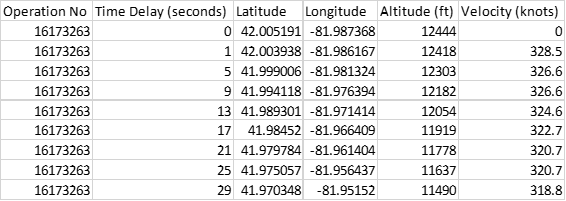
So with the data sample I'd like to end up with eight line segments that all have the Operation No. 16173263 and each segment would have the time delay, Latitude, Lon, Altitude & Velocity attributes of the starting point.
The radar plots for a single day contain approximately 1200 different flights and over 100,000 data points.
I have no python or coding experience and so far all QGIS experience consists purely of using menu driven functions.
Operation No, Time Delay (seconds), Latitude, Longitude, Altitude (ft), Velocity (knots)
16173263,0,42.005191,-81.987368,12444,0
16173263,1,42.003938,-81.986167,12418,328.5
16173263,5,41.999006,-81.981324,12303,326.6
16173263,9,41.994118,-81.976394,12182,326.6
16173263,13,41.989301,-81.971414,12054,324.6
16173263,17,41.98452,-81.966409,11919,322.7
16173263,21,41.979784,-81.961404,11778,320.7
16173263,25,41.975057,-81.956437,11637,320.7
16173263,29,41.970348,-81.95152,11490,318.8
16173264,0,41.512822,-82.082972,5331,0
16173264,3,41.513811,-82.078243,5266,258.5
16173264,7,41.515101,-82.071902,5180,258.5
16173264,11,41.516373,-82.065547,5105,258.5
16173264,15,41.517608,-82.059206,5036,258.5
16173264,19,41.518844,-82.052913,4970,256.6
16173264,23,41.520053,-82.04672,4905,252.7
16173264,27,41.521254,-82.040638,4846,246.9


