3

I need to make a number of maps where only one input changes (a layer with the range of a radio tower) and I want to add the layer, apply symbology, zoom to it, change the title to include the name of the tower and then export it as a pdf with the tower name.

Rather than adding the layers and applying symbology I can just put all the towers in a Group Layer and then the script can just turn all but one of them on, zoom, print and then turn it off and continue to the next tower.

One long way is using: Data Driven Pages --> Page Definition option in the Definition Query tab of a Layer's Properties and specifying this but I was wondering if there was an easier work around?
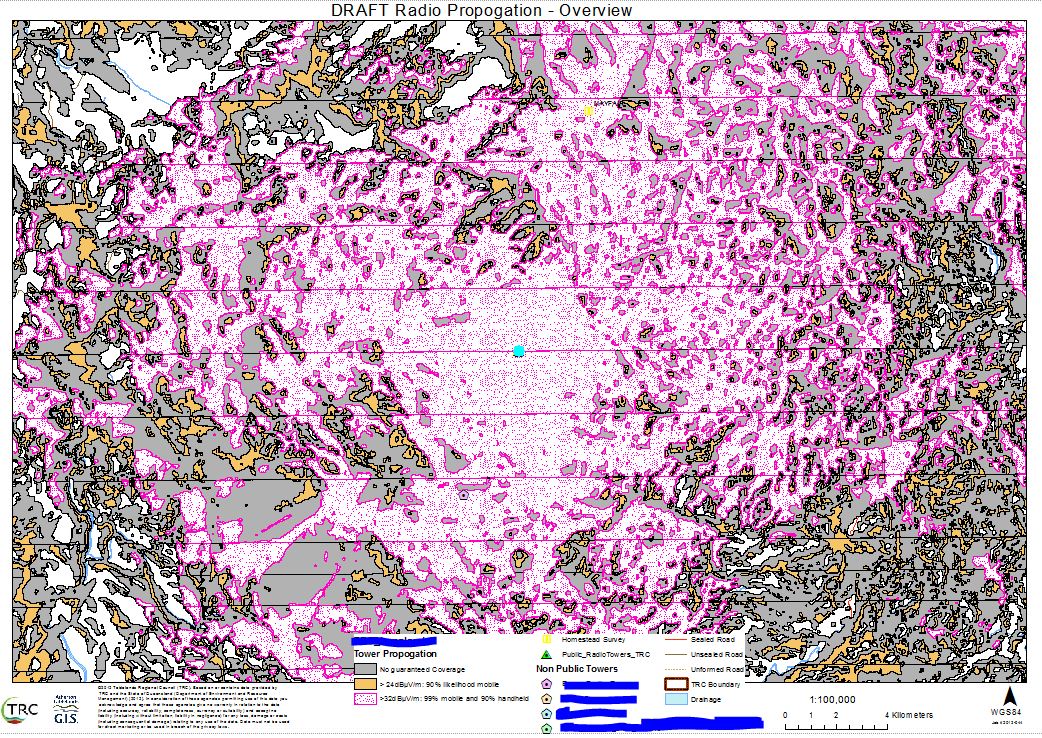
enter image description here

The issue with using Page Definitions is that some towers overlap and it means that I have to add in a column which will have have the tower name and signal strength repeatedly for each row. Given that we have more than 30 towers, even in a model this is laborious process that has to be then repeated when any base data changes.

2 Answers 2

4

I haven't played much with Data Driven Pages but if your tower ranges are all in the same feature class, you might be able to use Page Definition Queries to automatically display just one specific tower per page.

1
  • Oops, missed your edit where you already mention this. Sounds like the way to go though.
    – blah238
    Commented Apr 11, 2012 at 5:50
2

Why wouldn't you put all the towers in a single feature class, perhaps as a circle feature representing the range for each, and then use a Dynamic Text element for the title, reading it from a field in the data? Am I misunderstanding your requirements?

5
  • They are to complex and overlap each other. This map set is just to show the range of each individual tower. There is another mapset that has the intersect of the signals of each tower but that's a different issue.
    – GeorgeC
    Commented Apr 11, 2012 at 5:21
  • 1
    Are you saying the tower ranges are too complex to be stored in the same feature class? Sounds unlikely.
    – blah238
    Commented Apr 11, 2012 at 5:52
  • yes&no...each tower's range includes a grouped signal strength reading polygon. It is not a simple oval range. See the sample map that I will attach to the question along with some more details.
    – GeorgeC
    Commented Apr 11, 2012 at 5:58
  • I see! Very complex features indeed, derived from a raster analysis presumably?
    – blah238
    Commented Apr 11, 2012 at 6:33
  • vector points actually through a long convoluted process - see gis.stackexchange.com/questions/21420/…
    – GeorgeC
    Commented Apr 11, 2012 at 7:01

Your Answer

By clicking “Post Your Answer”, you agree to our terms of service and acknowledge you have read our privacy policy.

Not the answer you're looking for? Browse other questions tagged or ask your own question.