8

I'm not sure how to back-transform log-normal kriged results. This example using the "meuse" data shows how to make variogram and use it to get kriging predictions (and variances) using the popular 'gstat' package of R. The last few lines show backtransformation from log-space to original concentrations just using the 'exp()' function. I read some articles confirming biased outcome of this approach. I was wondering if anyone exactly knows how to convert the kriged predictions and variances to unbiased original mean concentrations and standard deviations using R.

library(gstat)
library(sp)

data(meuse)
coordinates(meuse) = ~x+y
data(meuse.grid)

#fit variogram
v = variogram(log(zinc)~1, data=meuse, meuse.grid)
m <- vgm(0.59,"Sph", 897, 0.05)
plot(v$dist, v$gamma, ylim=c(0,0.75), xlim=c(0,1600), xaxs="i", yaxs="i")
lines(variogramLine(m, maxdist=1600), lwd=2, lty=2, col=4) 

# do the prediction by kriging
gridded(meuse.grid) = ~x+y
a <- krige(log(zinc)~1, meuse, meuse.grid, m)

#back transformation to original concentration space?
#predictions
exp(a$var1.pred)
#standard deviations
exp(sqrt(a$var1.var))

3 Answers 3

7

When the prediction error of a model based on log(Y) is Gaussian like here, you normally should use the correction of Laurent (1963) to estimate back to the original scale.
In your case:
MeanY = exp(a$var1.pred + 0.5 * (a$var1.var))
and:
SdY = exp(2*a$var1.pred + a$var1.var)*(exp(a$var1.var)-1)

You can verify on yourself with simulation of a Gaussian distribution:

# Gaussian distribution
logY <- rnorm(100000, 0, 0.5)
mean(logY)
exp(mean(logY))
# Corrected Mu
exp(mean(logY) + 0.5 * var(logY))
# Corrected Var
exp(2*mean(logY) + var(logY))*(exp(var(logY))-1) 

# Verification with log-Gaussian distribution
Y <- exp(logY)
# Correct Mu
mean(Y)
# Correct Var
var(Y)
3
  • This is also supported by Cressie (1993) specifically for spatial statistics purposes. This approach is also used for example in Horálek et al. (2007).
    – Janina
    Commented Apr 21, 2017 at 12:30
  • just to make sure the corrected SdY is representing corrected variance, right? thanks
    – ToNoY
    Commented Apr 21, 2017 at 15:05
  • Yes, this is the corrected variance Commented Apr 21, 2017 at 19:10
5

A common misconception is that kriging estimates may be simply exponentiated to recover the field values.

Sebastien Rochette's suggests a back-transformation for field values y following Laurent (1963):

enter image description here

Because the prediction of log(y) is based on a Gaussian distribution, in many cases an additional correction factor is needed because the expected value of back-transformed lognormal kriging estimates are biased--not equal to the sample mean. One method is to multiply the above equation by a correction factor: the ratio of the sample mean to the back-transformed means (k_o in the equation below).

enter image description here

Here is a paper on the issue of back-transforming kriging estimates. It draws on the work of (Journel, 1978).

And here is a fully reproducible example in R:

# load required packages, and download missing ones
if (!require("pacman")) install.packages("pacman")
pacman::p_load(sp, raster, gstat, ggplot2, magrittr)

data(meuse) # load the meuse data set

# convert meuse into a spatial object
# first, prepare the 3 components: coordinates, data, and proj4string
coords <- meuse[ , c("x", "y")]   # coordinates
data   <- meuse[ , 3:14]          # data
crs    <- CRS("+init=epsg:28992") # proj4string of coords

# make the spatial points data frame object
d <- SpatialPointsDataFrame(coords      = coords,
                            data        = data, 
                            proj4string = crs)

r <- raster(d)                       # create raster to interpolate over
res(r) <- 100                        # raster resolution (100 meters)
g <- as(r, "SpatialGrid")            # convert raster to spatial grid object


d$zinc <- log(d$zinc)                # log transform field values

gs <- gstat(formula = zinc ~ 1,      # spatial data, so fitting xy as idp vars
            locations = d)           # spatial object

v <- variogram(gs,                   # gstat object
               width = 25)           # lag distance

# plot the variogram
# plot(v)                              

fve <- fit.variogram(v,              # takes `gstatVariogram` object
                     vgm(0.6,        # partial sill: semivariance at the range
                         "Exp",      # linear model type
                         1000,       # range: distance where model first flattens out
                         0.01))      # nugget

# plot variogram and fit
plot(v, fve)
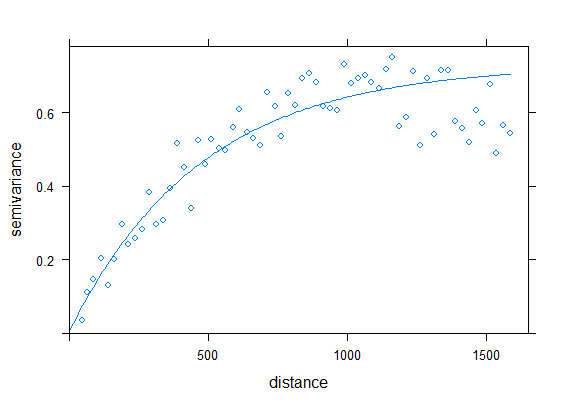
enter image description here

# ordinary kriging 
kp <- krige(zinc ~ 1, d, g, model = fve)

# backtransformed
bt <- exp( kp@data$var1.pred + (kp@data$var1.var / 2) )

# means of backtransformed values and the sampled values
mu_bt <- mean(bt)
mu_original <- mean(exp(d$zinc))

# these means differ...  
> mu_bt
[1] 673.0071
> mu_original
[1] 469.7161

# ...thus make another correction to remove kriging bias in sample mean
btt <- bt * (mu_original/mu_bt)             # correct backtransfomed vals
kp@data$var1.pred <- btt                    # overwrite w/ correct vals 
names(kp) <- c("Prediction", "variance")
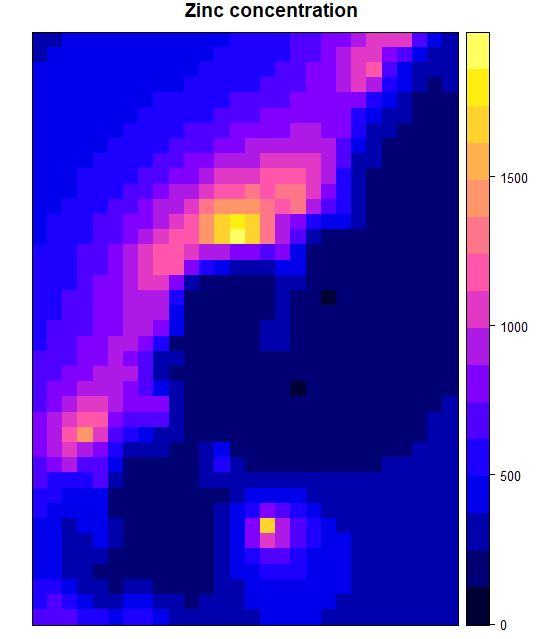
spplot(kp, "Prediction", main = "Zinc concentration")
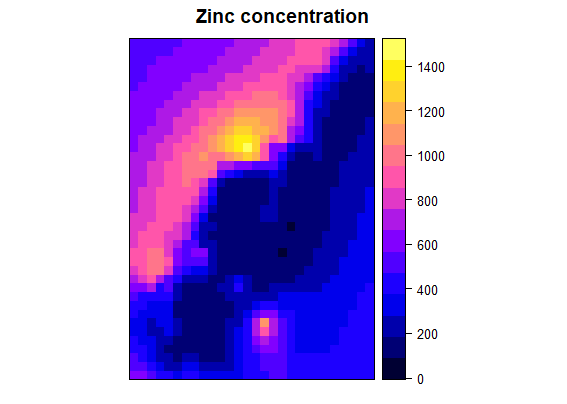
enter image description here

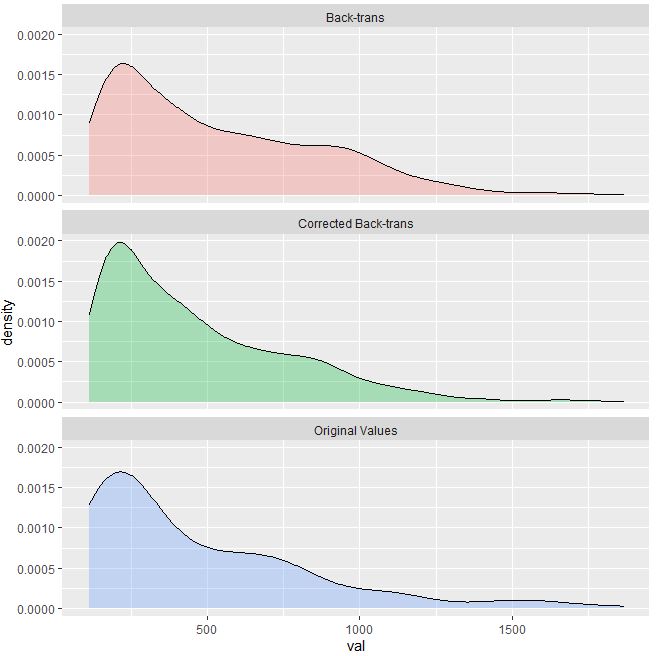
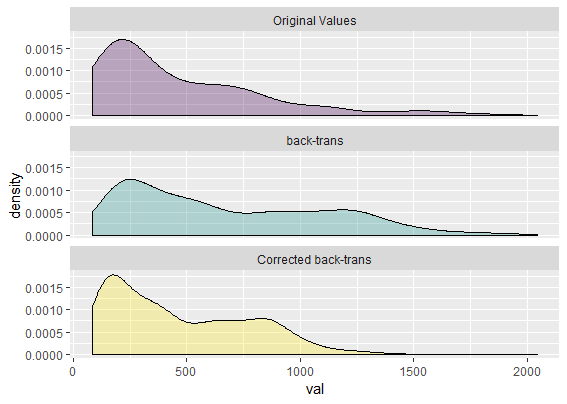
# we can view the motivation for this transformation by comparing the 
# original zinc values to the kirging estimates generated by the
# backtransformation, and the corrected backtransformation
rbind.data.frame(
  data.frame(val = exp(d$zinc), class = "Original Values"), 
  data.frame(val = bt,          class = "Back-trans"), 
  data.frame(val = btt,         class = "Corrected Back-trans")
) %>% 
  ggplot(aes(val)) + 
  geom_density(aes(fill=class), alpha = 0.3) +
  facet_wrap(~class, ncol=1) +
  guides(fill = FALSE)
enter image description here

Summary

It's clear that the density distribution of the corrected backtransform aligns with the sample density distribution, indicating less bias compared to the simple backtransformation without the correction coefficient.

1
  • Is the variance back-calculation similar where a correction factor be applied? Commented Nov 23, 2021 at 13:46
0

Noel Cressie stated the unbiased unbiased predictor of Z which is lognormally distributed as below :

enter image description here

I am also working on deriving the equation and the only way I found is like this : enter image description here

enter image description here to satisfy the unbiasedness assumption.

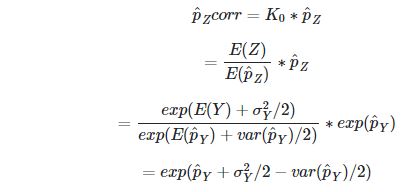
I have tried the code on R that Rich Pauloo had given and I make some change on the back-transform equation based on the derivation above, started from the ordinary kriging :

enter image description here

enter image description here

enter image description here

enter image description here

I don't think that overwriting the corrected back-transformed values to the kriging is necessary, however I have problem when I tried to apply spplot direct on pzcorr. Any way, thanks for raising this topic, I'm a new learner in geostatistics and R. The examples and explanations help me a lot.

2

Your Answer

By clicking “Post Your Answer”, you agree to our terms of service and acknowledge you have read our privacy policy.

Not the answer you're looking for? Browse other questions tagged or ask your own question.