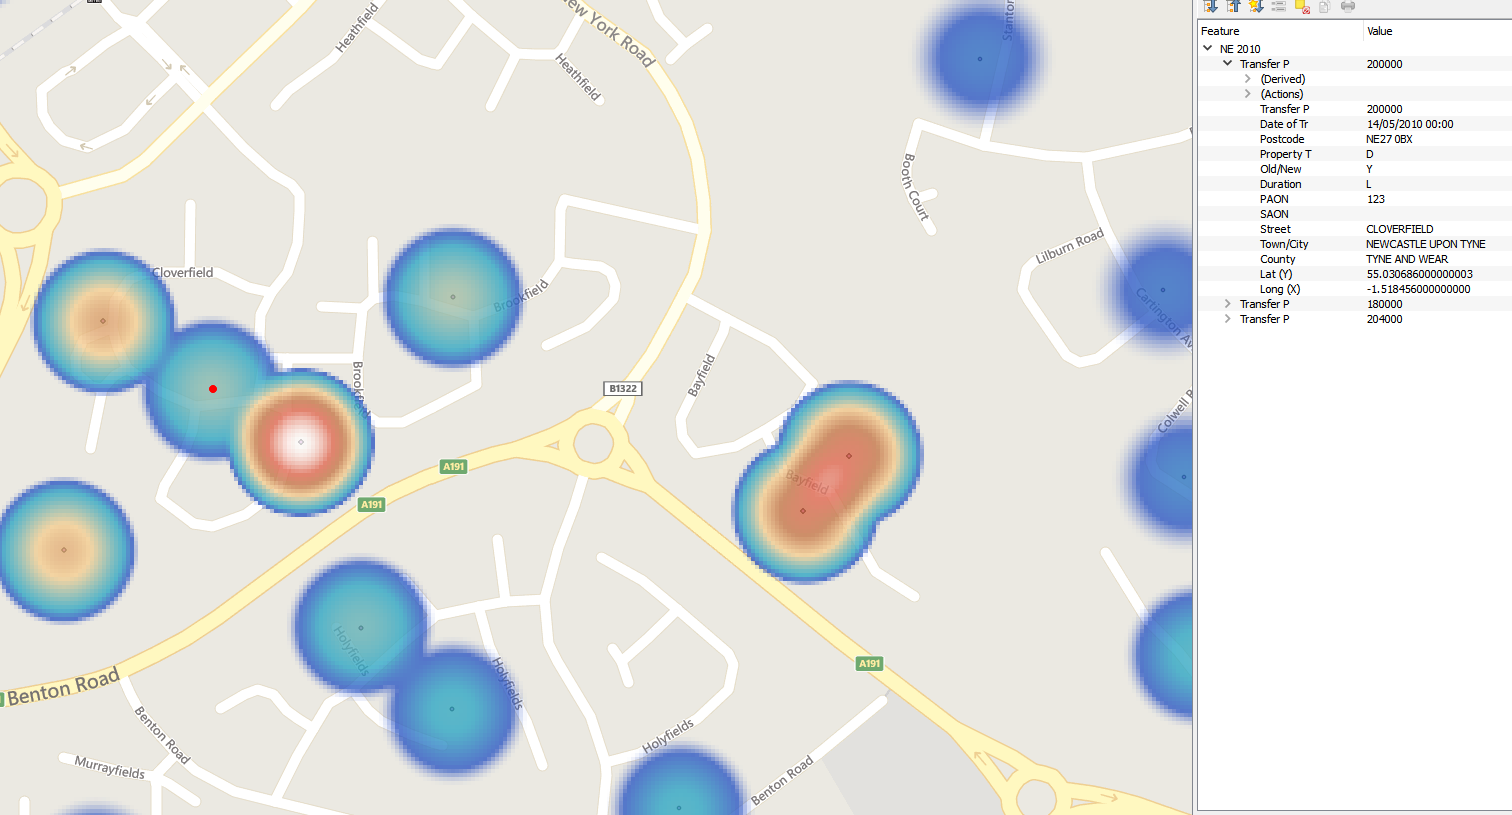
I have house price data for the UK plotted by postcode, rendered as a heatmap.
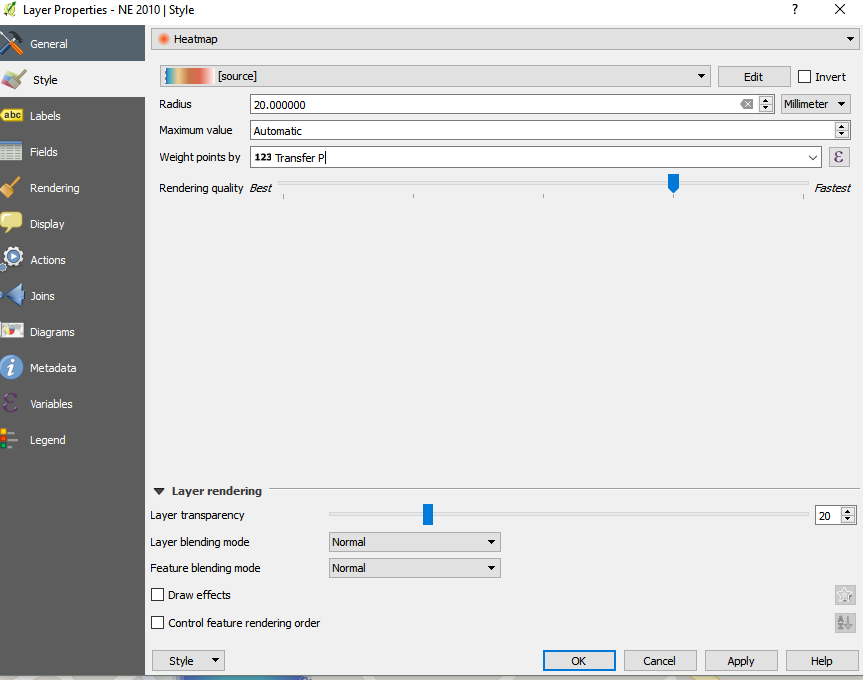
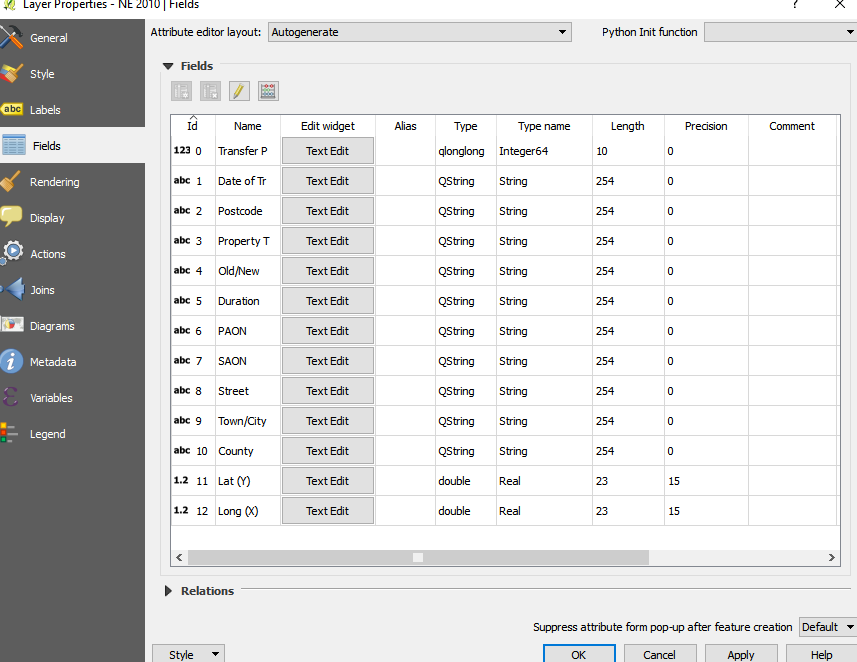
I have styled the heatmap to weight points by transfer price and not concentration of points, however I'm running into issues. (See below)
Highlighted point contains 12 houses (with same postcode) at average house sale of £196,721

Highlighted point contains 8 houses (with same postcode) at average house sale of £192,375

Highlighted point contains 3 houses (with same postcode) at average house sale of £194,666

So with all three areas containing the same average house price, the clusters are still weighted by concentration of points.
However, there are times when the heatmap seems to work:
What the heck is going on?


