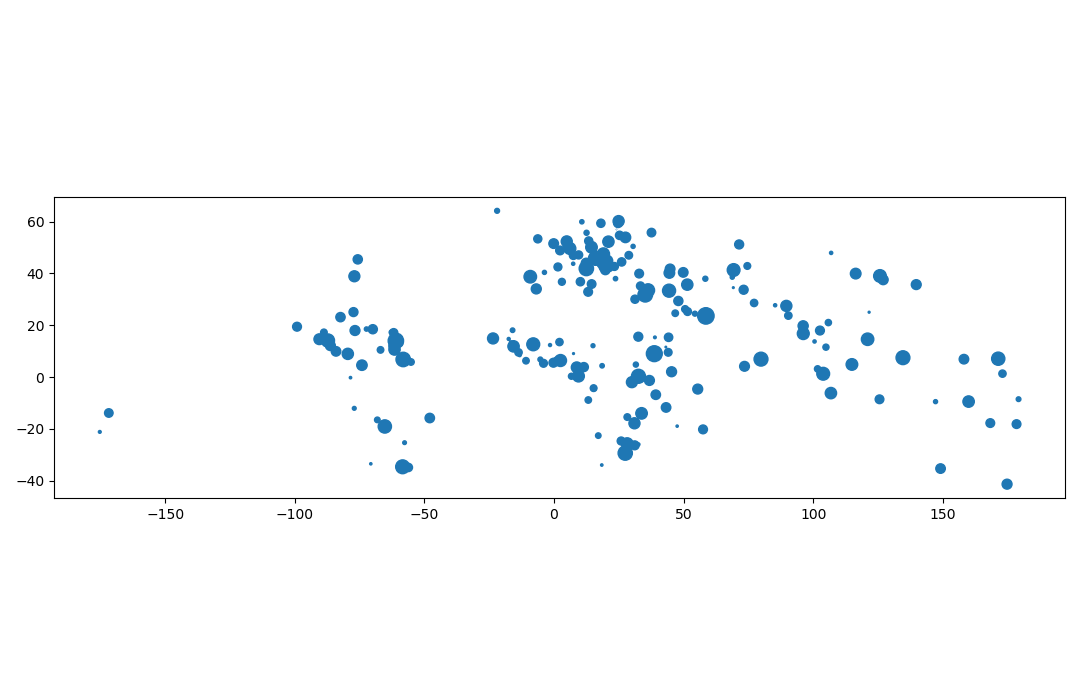
I have a geodataframe with points and some associated data. I want to plot it on a map using geopandas and have the size of the points correspond to one of the columns in the geodataframe.
So far I have the following code:
base = world.plot(color='white', figsize=(20,10))
geo_df.plot(ax=base, marker='.', color='red', markersize =
geo_df['Pop_2005'])
plt.xlim([-85, -60])
plt.ylim([-5, 12.5]);
But I'm getting the following error: TypeError: cannot convert the series to <class 'float'>
Any ideas?


Pop_2005explicitly to a float or integer?geo_df['Pop_2005'] = geo_df['Pop_2005'].astype(float)