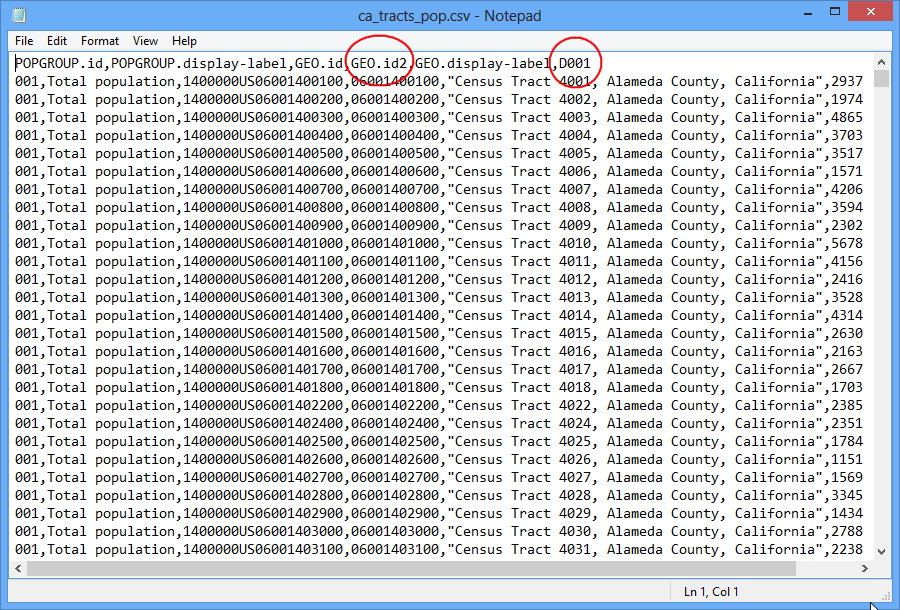
I imported water contamination data from surface water bodies from a CSV file. Each water body was georeferenced with a single pair of lat/long coordinates. Now I have a map full of individual points which are located somewhere at the border of a lake, river etc. I only have one point per surface water body (no contours or similar).
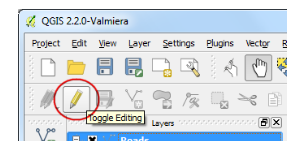
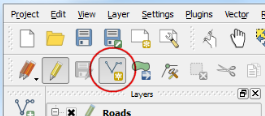
How can I manually draw a shapefile around the points (depict the surface water bodies) which has the same properties (attribute table) as the respective point?


