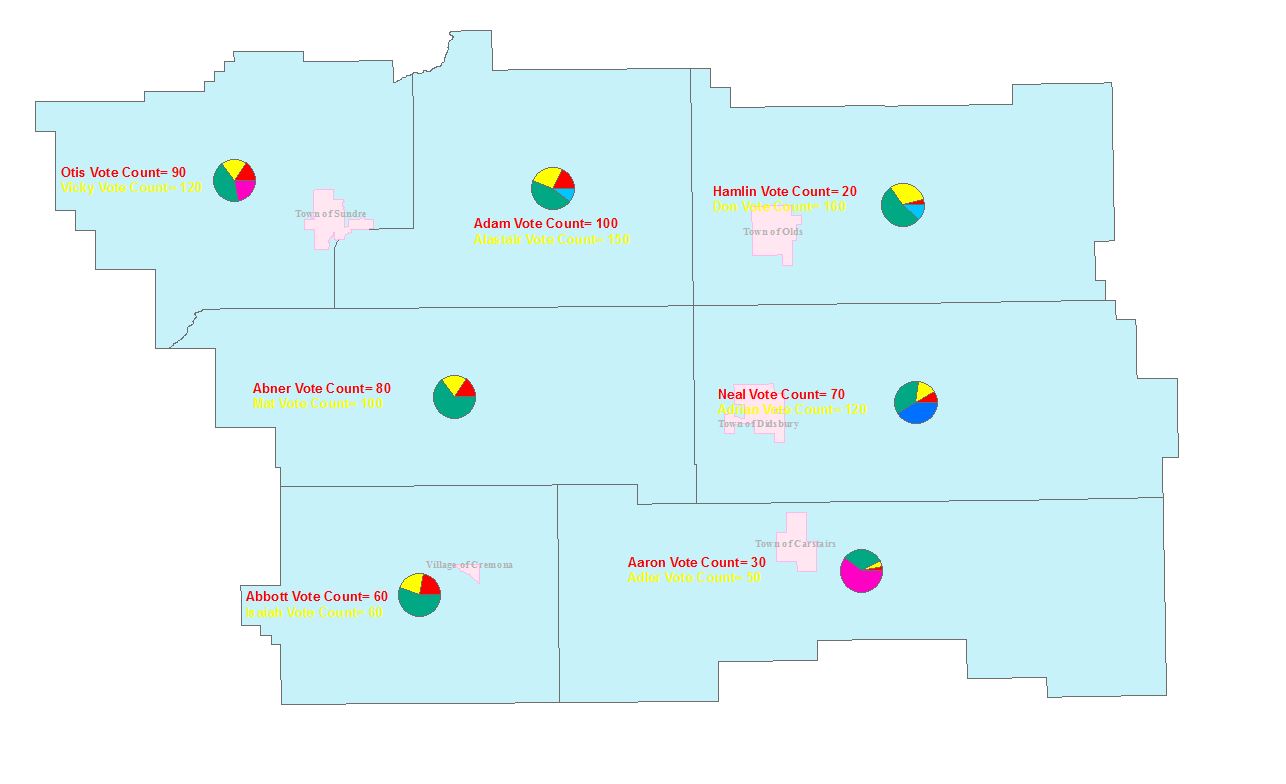
I am trying to make election map so I can draw chart and label with same chart color. So I have six election zone and running candidates may be up-to six or less. So if some election zone might have only two candidates so it should label only 2 not the empty value. Labeling should be stacked and should match with the color code of the charts. Here is my code which worked if all the column has value. On candidate 4 which has only 4 won,t label it. All the document is attached.
def FindLabel ( [Sheet1$.Candiate1], [Sheet1$.Candiate2], [Sheet1$.Candiate3], [Sheet1$.Candiate4], [Sheet1$.Candiate5], [Sheet1$.Candiate6], [Sheet1$.VoteCount1],[Sheet1$.VoteCount2],[Sheet1$.VoteCount3],[Sheet1$.VoteCount4],[Sheet1$.VoteCount5],[Sheet1$.VoteCount6] ):
if [Sheet1$.VoteCount1]> 0: [Sheet1$.Candiate1]= [Sheet1$.Candiate1]+" Vote Count= "+Sheet1$.VoteCount1]
if [Sheet1$.VoteCount2] > 0: [Sheet1$.Candiate2]= [Sheet1$.Candiate2]+" Vote Count= "+sheet1$.VoteCount2]
return "" +[Sheet1$.Candiate1]+"" +'\n'+""+[Sheet1$.Candiate2]+ ""

