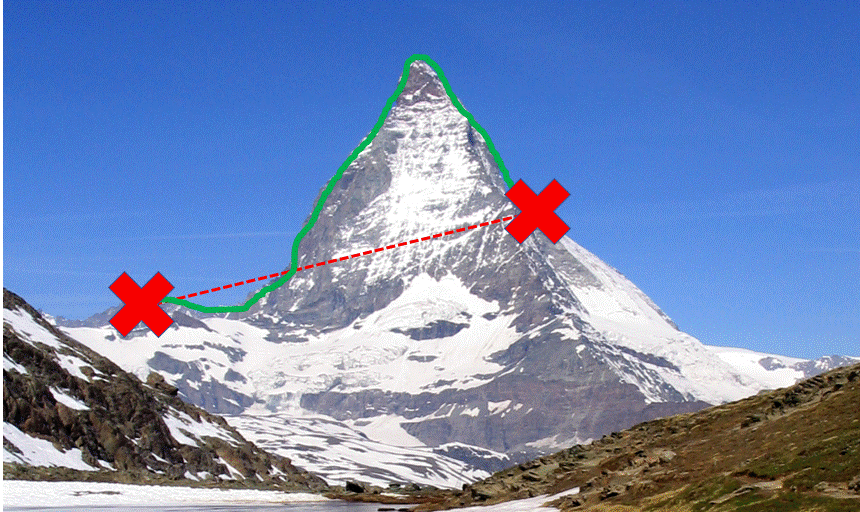
Is it possible to compute the distance between 2 coordinates (x1,y1,z1) - (x2,y2,z2) considering an elevation raster (cells containing elevation)? On the image, there are 2 coordinates (red crosses). I would like the green distance. I know how to get the direct distance taking the elevation into consideration (red dashed line on the picture), but this does not take that there can be a mountain or a valley between the 2 points into account. I am using R but if there is a nice way to do it in QGIS that would be great too.
-
What have you done so far? Which software? R or QGIS? Please edit your question, it's too broad– aldo_tapiaCommented Aug 17, 2017 at 11:38
-
What is an elevation matrix? Maybe it's me, but I have the strong feeling that this question is better asked at MathOverflow ...– pLumoCommented Aug 17, 2017 at 11:46
-
I think that "elevation matrix" is referring to a raster containing elevation data in its cells, such as a DEM.– KingfisherCommented Aug 17, 2017 at 13:41
4 Answers
In R this is fairly straight forward for two points. There are functions to return the distance matrix and for extracting the elevation for the points based on a DEM.
First add the required packages and, here create a dummy raster for example purposes. You can use the "raster" function to read your elevation raster from disk.
library(raster)
library(sp)

e <- as(extent(-1942755,-1847241,2524840,2624901), "SpatialPolygons")
  proj4string(e) <- "+proj=aea +lat_1=29.5 +lat_2=45.5 +lat_0=23 +lon_0=-96 +x_0=0 +y_0=0 +datum=NAD83 +units=m +no_defs +ellps=GRS80 +towgs84=0,0,0"

r <- raster(e, res=1000)
  r[] <- runif(ncell(r),500,2500)
Now, using raster::extract we can extract the elevation values for the two points of your path and return the uncorrected straight line distance between the points using spDists.
xy <- list( coordinates( sampleRandom(r, 2, sp=TRUE) ) )
  elev <- extract(r, SpatialPoints(xy))
  d <- spDists( SpatialPoints(xy) )[2]
Using the data generated above, it is a simple matter of deriving the corrected distance.
elev.delta <- max(elev) - min(elev)
sqrt(d^2 + elev.delta^2)
Where it gets more complicated is if you want to correct the distance along the entire path, which in this case would be defined by the cell size of the raster underlying the straight line or, even an irregular path. You would need to set up a looping structure to calculate the corrected distances for each line segment.
A starting point is to coerce your points to a sp line object, calculate the length of the line using sp::SpatialLinesLengths (same result as sp::spDists) and extract all of the underlying elevation values with raster::extract.
At this point you would be set up to loop through each elevation value to return the corrected distance for all elevation deltas to then add to the uncorrected distance [d]. This would effectively be slope corrected distance.
l <- SpatialLines(list(Lines(list(Line(xy)),ID="1")))
( d <- SpatialLinesLengths(l) )
( elev <- unlist(extract(r, l)) )
-
Hi! Great! It is the second part of your answer I was looking for. I want to correct for each cell. I have a raster with 2x2m cells. However, the line segment in a cell has not always the same length. Do you know how to get this value?– LucCommented Aug 18, 2017 at 9:19
-
@Luc you could coerce your raster to a SpatialGridDataFrame object then use sp::over or raster::intersect to break the line into segments that intersect each cell. Then line lenghts will reflect the length of the intersections. You would get the elevation values as well. However, this is not memory safe and easly fail given a large raster. Commented Aug 18, 2017 at 14:48
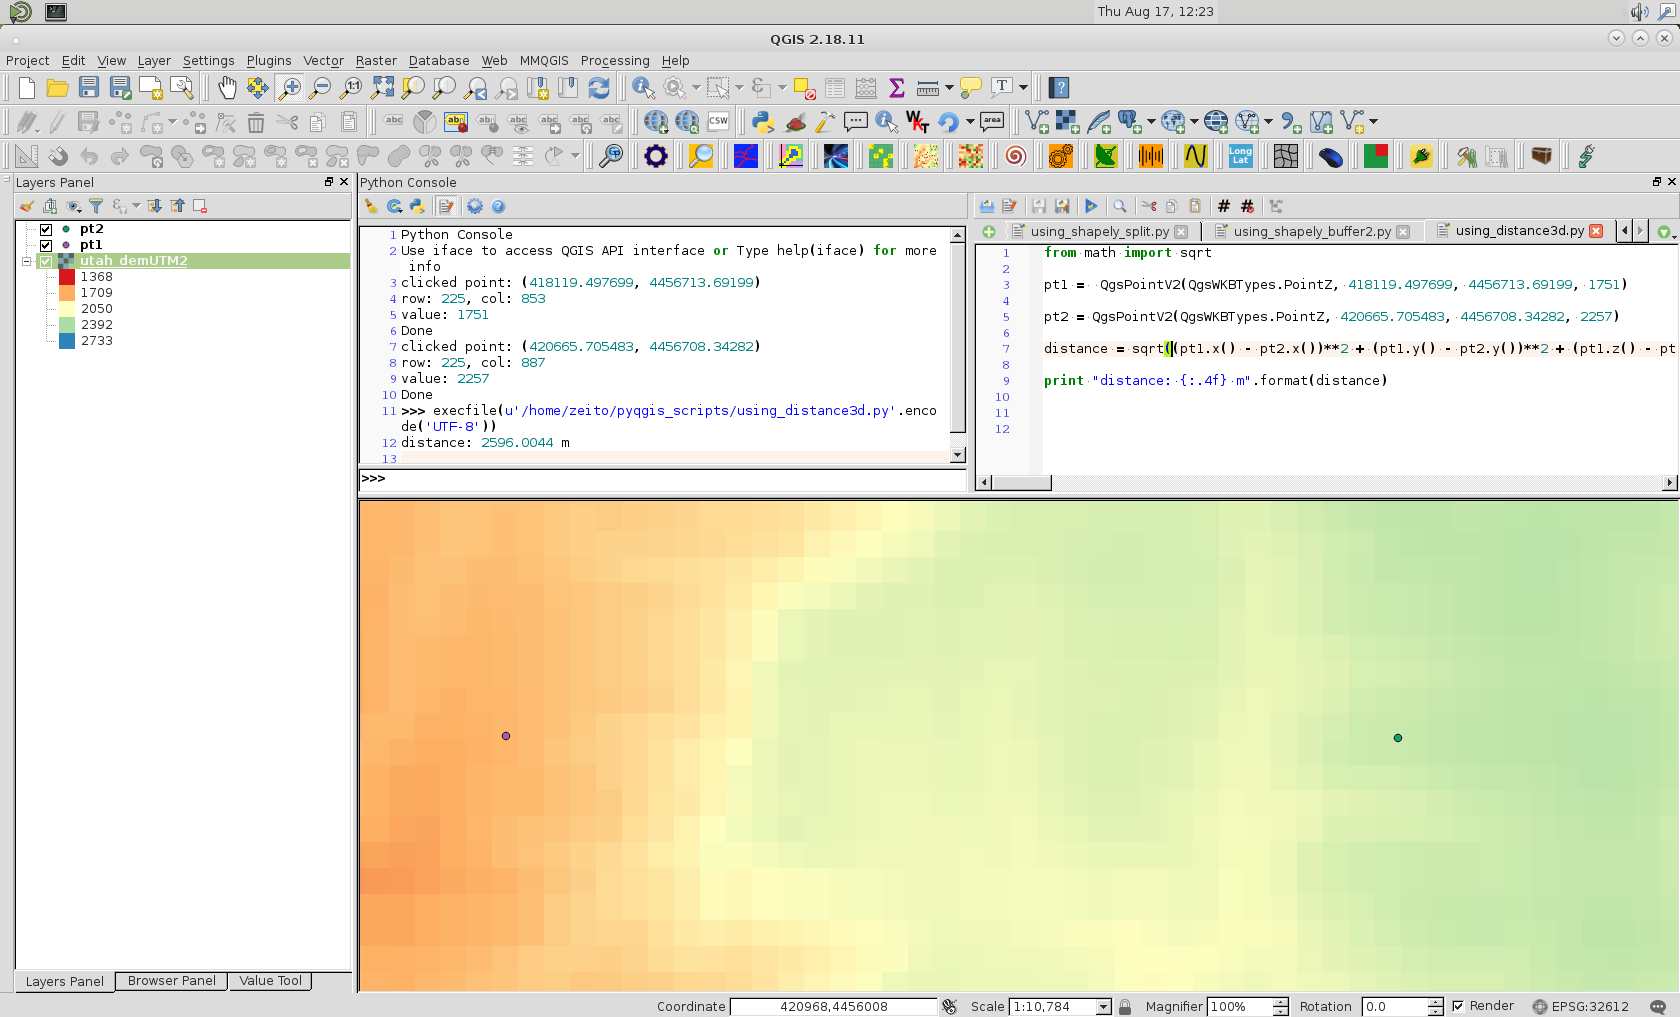
Assuming that you can easily access to point coordinates and its elevation values, distance can be computed with a simple PyQGIS script. To test my approach, I have a QGIS plugin that it can get point coordinates and values for a raster. For 2 arbitrary points over my raster (see next image):
python code is as follow:
from math import sqrt

pt1 =  QgsPointV2(QgsWKBTypes.PointZ, 418119.497699, 4456713.69199, 1751)

pt2 = QgsPointV2(QgsWKBTypes.PointZ, 420665.705483, 4456708.34282, 2257)

distance = sqrt((pt1.x() - pt2.x())**2 + (pt1.y() - pt2.y())**2 + (pt1.z() - pt2.z())**2)

print "distance: {:.4f} m".format(distance)
For my example, after running above code at Python Console of QGIS I got:
distance: 2596.0044 m
Unfortunately, QgsPointV2 doesn't have yet a distance function as QgsPoint class and QgsGeometry class (it also has a distance function) cannot be instancied with a QgsPointV2 object.
-
Hi! Thank you very much for your quick answer. If I understand correctly your script, it get's the direct distance (red dashed line on my picture). Do you know a way to get the green line? Thanks again– LucCommented Aug 17, 2017 at 18:47
Possible solution: (takes a long time to compute)
library(raster)
library(sp)

# create elevation raster
e <- as(extent(-1942755,-1847241,2524840,2624901), "SpatialPolygons")
proj4string(e) <- "+proj=aea +lat_1=29.5 +lat_2=45.5 +lat_0=23 +lon_0=-96 +x_0=0 +y_0=0 +datum=NAD83 +units=m +no_defs +ellps=GRS80 +towgs84=0,0,0"

r <- raster(e, res=1000)
r[] <- runif(ncell(r),500,2500)

# plot raster
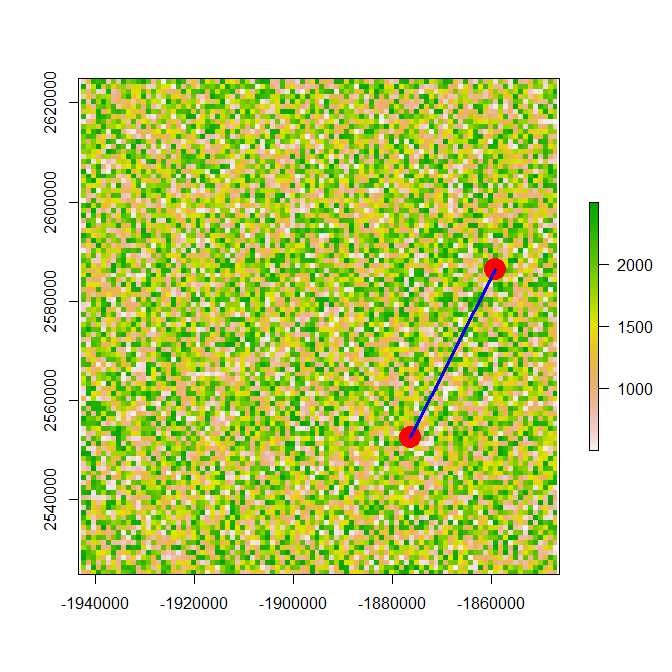
x11()
plot(r)

# creat coordinates
xy <- data.frame(x= c(-1859255, -1876255), y=c(2586401, 2552401))

# add coordinates to plot
points(-1859255, 2586401, col="red", cex=3, pch= 19)
points(-1876255, 2552401, col="red", cex=3, pch= 19)

#creat spatial line
l <- SpatialLines(list(Lines(list(Line(xy)),ID="1")))

#add spatial line to plot
plot(l, add=TRUE, lwd=3, col="Blue")

#create points along line
library(rgeos)
library(sp)
numOfPoints  <-  gLength(l)*10 #segments of 10cm if l in meters
points<-spsample(l, n = numOfPoints, type = "regular")

#add points to plot
plot(points, add=TRUE)


#get elevation for each points
points.df<-as.data.frame(points)
points.df$elevation<-raster::extract(r, points.df)

#comput distance between each points

head(points.df)
output<-data.frame(length=1:length(points.df$x))
i.2<-(length(points.df$x)-1) #last point has no further point for a distance
for(i in 1:i.2){

x1<-points.df[i,"x"]
x2<-points.df[i+1,"x"]
y1<-points.df[i,"y"]
y2<-points.df[i+1,"y"]
z1<-points.df[i,"elevation"]
z2<-points.df[i+1,"elevation"]


Distance<-((x1-x2)^2+(y1-y2)^2+(z1-z2)^2)^0.5

output[i,]<-Distance
}
output[length(points.df$x),]<-0 #last point has no further point for a distance

sum(output) # Length between A and B
This method allows for the calculation of the distance between two coordinates (A,B) considering an elevation raster. The "line" is fragmented into segments delimited by sub-coordinates (points) plotted at an equal distance on the line. The line is thus linking points A and B by following the raster layer surface. When two sub-coordinates are in the same cell, the distance is the horizontal distance (blue). When the two coordinates are in differents cells, the distance is the hypotenuse length (red). 
-
This does not provide an answer to the question. To critique or request clarification from an author, leave a comment below their post. - From Review– KerstenCommented Aug 18, 2017 at 10:26
-
Hi! Sorry, but I did not find how to comment and add pictures.– LucCommented Aug 18, 2017 at 10:35
-
Your question can be in fact divided in two parts :
How to create a 3D polyline over a dem ? In this step, you would need to draw a 2D polyline for the 2D geometry, then convert it into a 3D line with each vertex on a pixel of your dem (or at least dense enough to get a good length approximation) and each Z value equals to the dem below the vertex.
How to calculate a 3d polyline length ? In this step, you will calculate each individual segment distance, considering the step value you assign between vertex + Z difference. That is a geometrical algebra operation you could do in Excel I suppose.
@xunilk has provided this solution with GRASS (that you should be able to access through QGIS) for a similar question : How to calculate the 3D length of line segment in QGIS?


