I have a LiDAR dataset with some missing data right in the middle of my map. I would like to use a 5m DEM to fill in the missing areas.
Is there a way in QGIS to merge the two but only use the 5m data in the missing location?
I'm not aware of any way to do it from within QGIS but GDAL can do it from the commandline. The basic steps are:
gdalinfo against your DEM files. SRC_SRS should match the value from your low-res file while DST_SRS, X_RES, and Y_RES should match the values from your high-res files. Note that the SRS specifications must be of the form ESPG:nnnn and not the textual form that gdalinfo outputs. The correct numeric form for a given projection can be looked up at https://epsg.io-te (south-west and north-east corners in the projections units, at least for UTM) should be large enough to cover the area missing from the high-res data but the area covered shouldn't be much too large because the low-res DEM will be upsampled to the higher resolution.-r lanczos) is important; if omitted you'll end up with a blocky, checkerboard pattern in the low-res areas.gdalwarp -s_srs SRC_SRS -t_srs DST_SRS -te EAST_0 NORTH_0 EAST_1 NORTH_1 -tr X_RES Y_RES -r lanczos SRC.img DST.tif
gdal_merge.py -o OUT.tif DEM_FILES
(if not specified, the default output file is out.tif) DEM_FILES is a list of all the DEMs to combine. The lowest resolution files should be listed first and the highest-resolution should be listed last, per the man page:
In areas of overlap, the last image will be copied over earlier ones.
gdaldem hillshade OUT.tif OUTPUT_HILLSHADE.tif
gdal_contour -i CONTOUR_METERS -nln NAME OUT.tif OUTPUT_SHAPEFILE_DIR/
For example:
imgn45w074_13.img is a ⅓ arc-second (10m) resolution, 1°×1° coverage, NAD-83 projection DEM from the USGS NED18TXQ601902.img and 18TWQ598902.img are 1m resolution, 1.5km×1.5km coverage, UTM 18N LIDAR DEMs (acquired from https://orthos.dhses.ny.gov/)gdalwarp -s_srs EPSG:4269 -t_srs EPSG:26918 -te 598500.000 4902000.000 604500.000 4903500.000 -tr 1 -1 -r lanczos imgn45w074_13.img imgn45w074_13.utm_18N.tif
gdal_merge.py 18TXQ601902.img 18TWQ598902.img imgn45w074_13.utm_18N.tif
gdaldem hillshade out.tif Hillshade.tif
gdal_contour -i 1 -nln Crows out.tif Crows-1m/
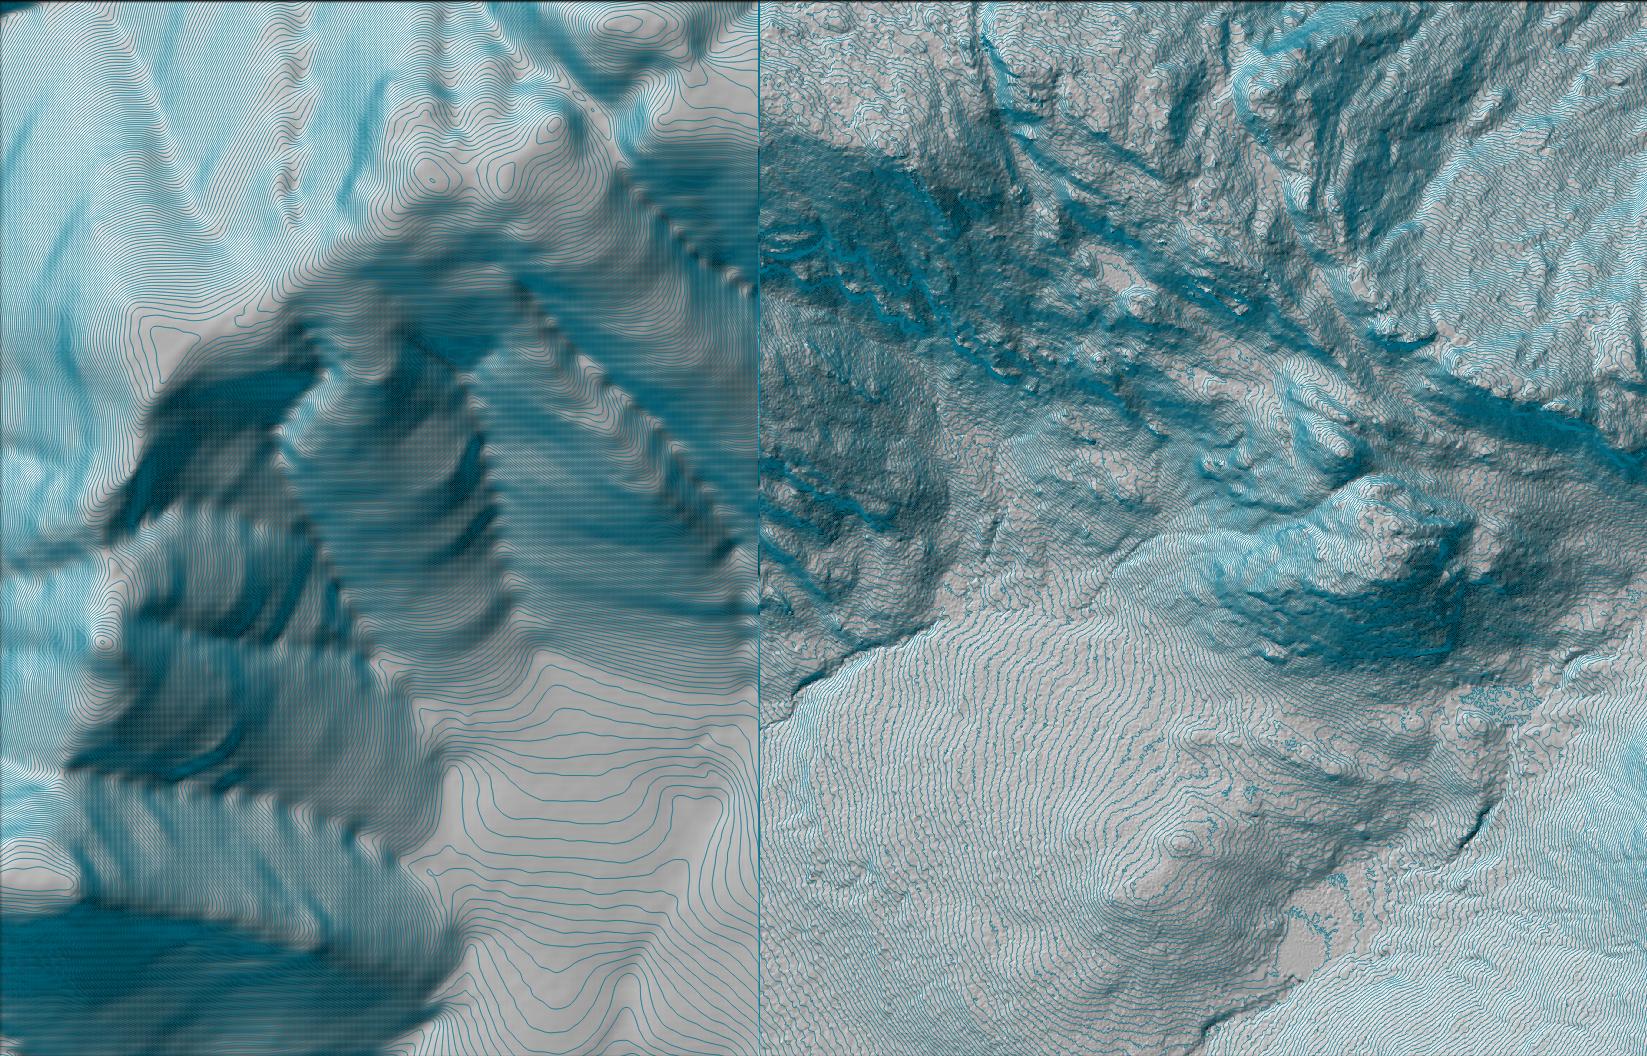
Here's the resulting hillshade (reduced in resolution for the web)
 From left to right, the first and third squares are derived from 1m LIDAR data and the remaining portion of the image is from the NED radar data. Here's a close-up:
 Importing
 Crows-1m/Crows.shp and Hillshade.tif into QGIS this gives the following (close-up shown):

I'm not sure how to handle the visible lines at the high-res/low-res boundaries. When I've encountered this in the past the solution was to combine all of the input files into a single VRT file. In this case, however, using a VRT file makes no difference.
Things are a bit trickier if you want to work with VRT files instead of using gdal_merge.py to create a new physical file. gdalbuiltvrt is very fussy about the input files being the same resolution, projection, etc. You'll need to do something like this:
gdalwarp -s_srs SRC_SRS -t_srs DST_SRS -te EAST_0 NORTH_0 EAST_1 NORTH_1 -tr X_RES Y_RES -r lanczos LOW_1.img DST_1.tif
gdalwarp HIGH_2.img DST_2.tif
gdalwarp HIGH_3.img DST_3.tif
gdalwarp HIGH_N.img DST_N.tif
gdalbuildvrt OUTPUT.img.vrt DST_1.tif DST_2.tif DST_3.tif DST_N.tif
You can do this from within the QGIS GUI using Processing -> GRASS -> r.patch (https://grass.osgeo.org/grass70/manuals/r.patch.html), which will fill in areas of no data in an input raster using data from another raster.
This does not do any form of smoothing though, so you will still end up with blocky edges as per the answer from @Alex Hajnal above.