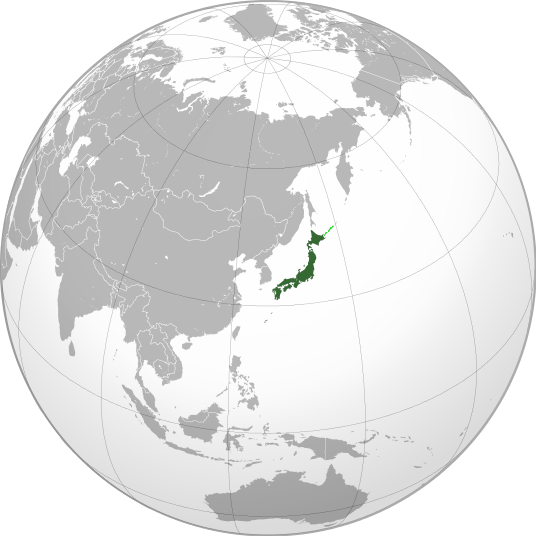
1

As they say, a picture is worth more than a thousand words:

Turkey in Wikipedia

enter image description here

What I need is to create maps for an educational system, and though we can create them manually in a lot of environments, my requirement is to make maps dynamically based on different criteria.

A simple starting point is to create a two-colored map to show the region of interest in an attractive color, among its neighbors which are rendered in gray color. This image from Wikiepdia is another example.

enter image description here

I have the WKT database of countries, and cities, and other geographical data. How can I create images from them this way?

I've tried SQL Server's spatial results pane, yet it renders regions in a multicolored map, with random color given to any region. Not useful at all.
I also searched the web to find some online WKT rendering pages, but they also don't give me the flexibility of programming, and also their background map is Google Map with no access to make it a flat simple map.

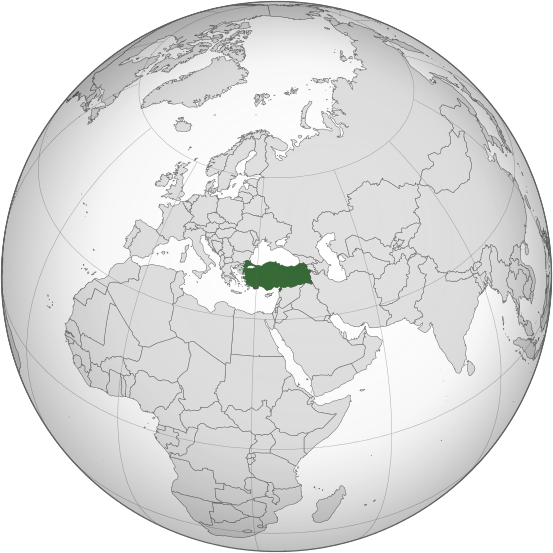
2
  • 1
    Please place graphics within the question. Links die, rendering the question nearly useless (especially true if you don't use words as well, and egregiously so if you misspell the counry name in the link). Please edit the question.
    – Vince
    Commented Sep 10, 2017 at 18:55
  • 1
    They say a picture is worth a thousand words but a map is worth a thousand pictures.
    – Fezter
    Commented Sep 10, 2017 at 23:42

2 Answers 2

5

This is exactly the situation that QGIS' atlas functionality is for. You set up a master map (in your case the whole globe) and then it works through your dataset of countries producing an image for each map automatically. So there is no need for any scripting at all.

1
4

You could go the GIS route - use QGIS, and use its Python automation to generate a map and export it to an image.

If you like Javascript, D3 can make nice maps. You will need to convert the geometry from WKT to GeoJSON. The tool Wellknown can do this for you.

If you like Python, there's Kartograph. I don't think you can render WKT with it directly, but if you can find your data in shapefile format then it could work.

Both D3 and Kartograph generate SVG, so if you need an image format then you will need another conversion step.

Another Python alternative would be to use a combination of Shapely, MatPlotLib, and Descartes. Here's a blog post that shows a map creation workflow.

Not the answer you're looking for? Browse other questions tagged or ask your own question.