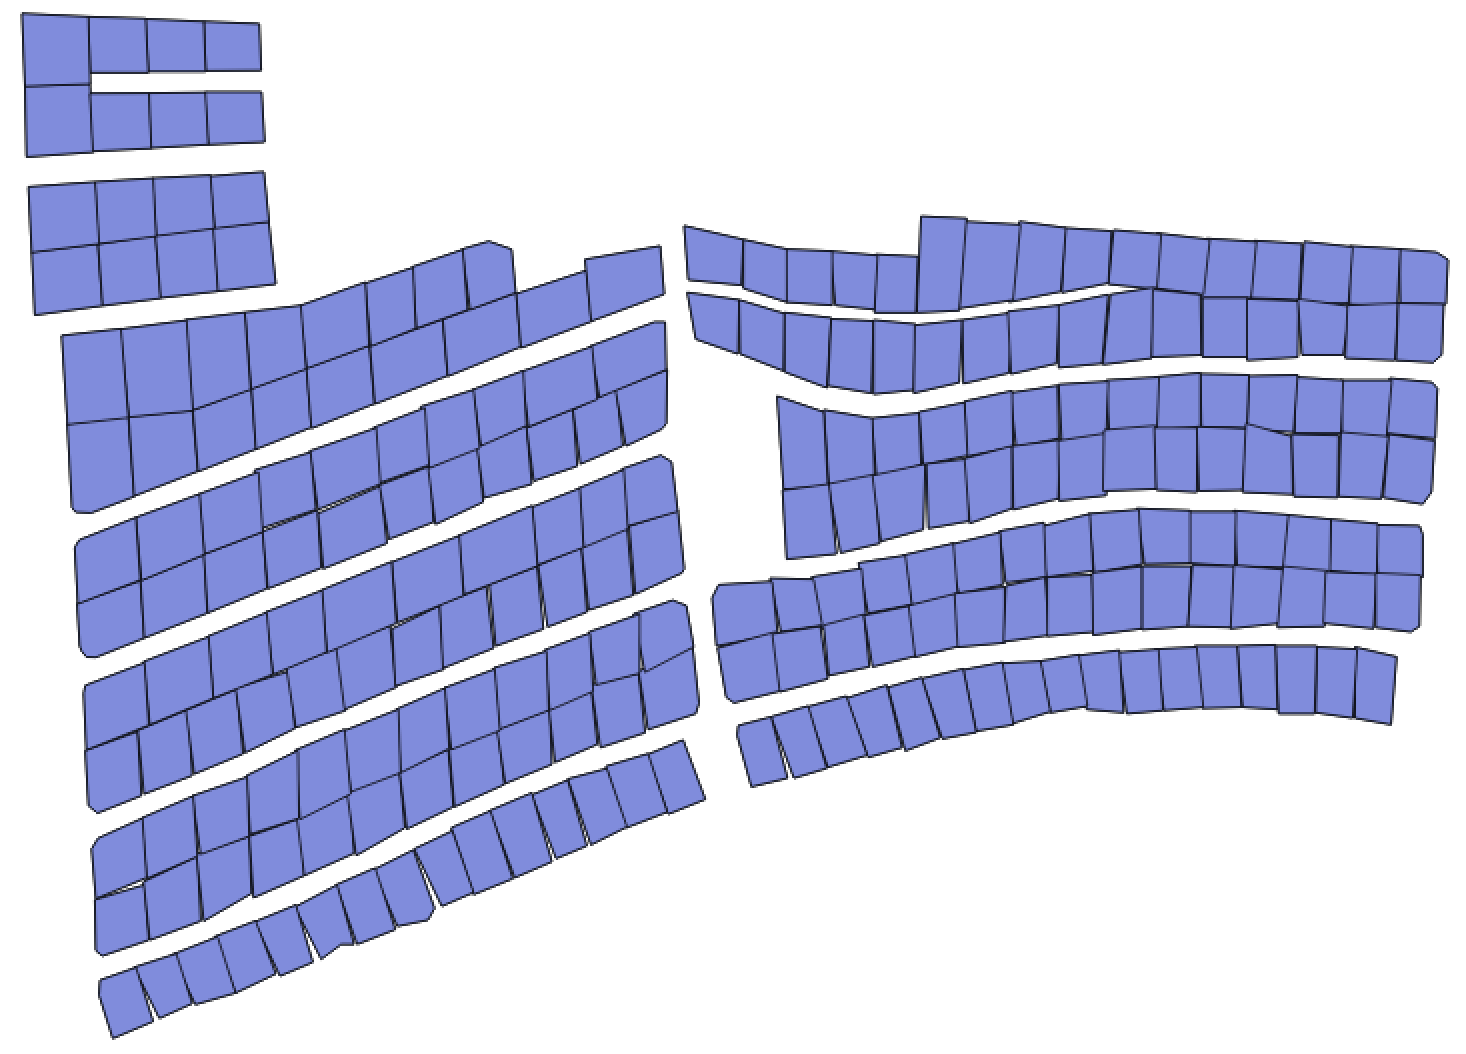
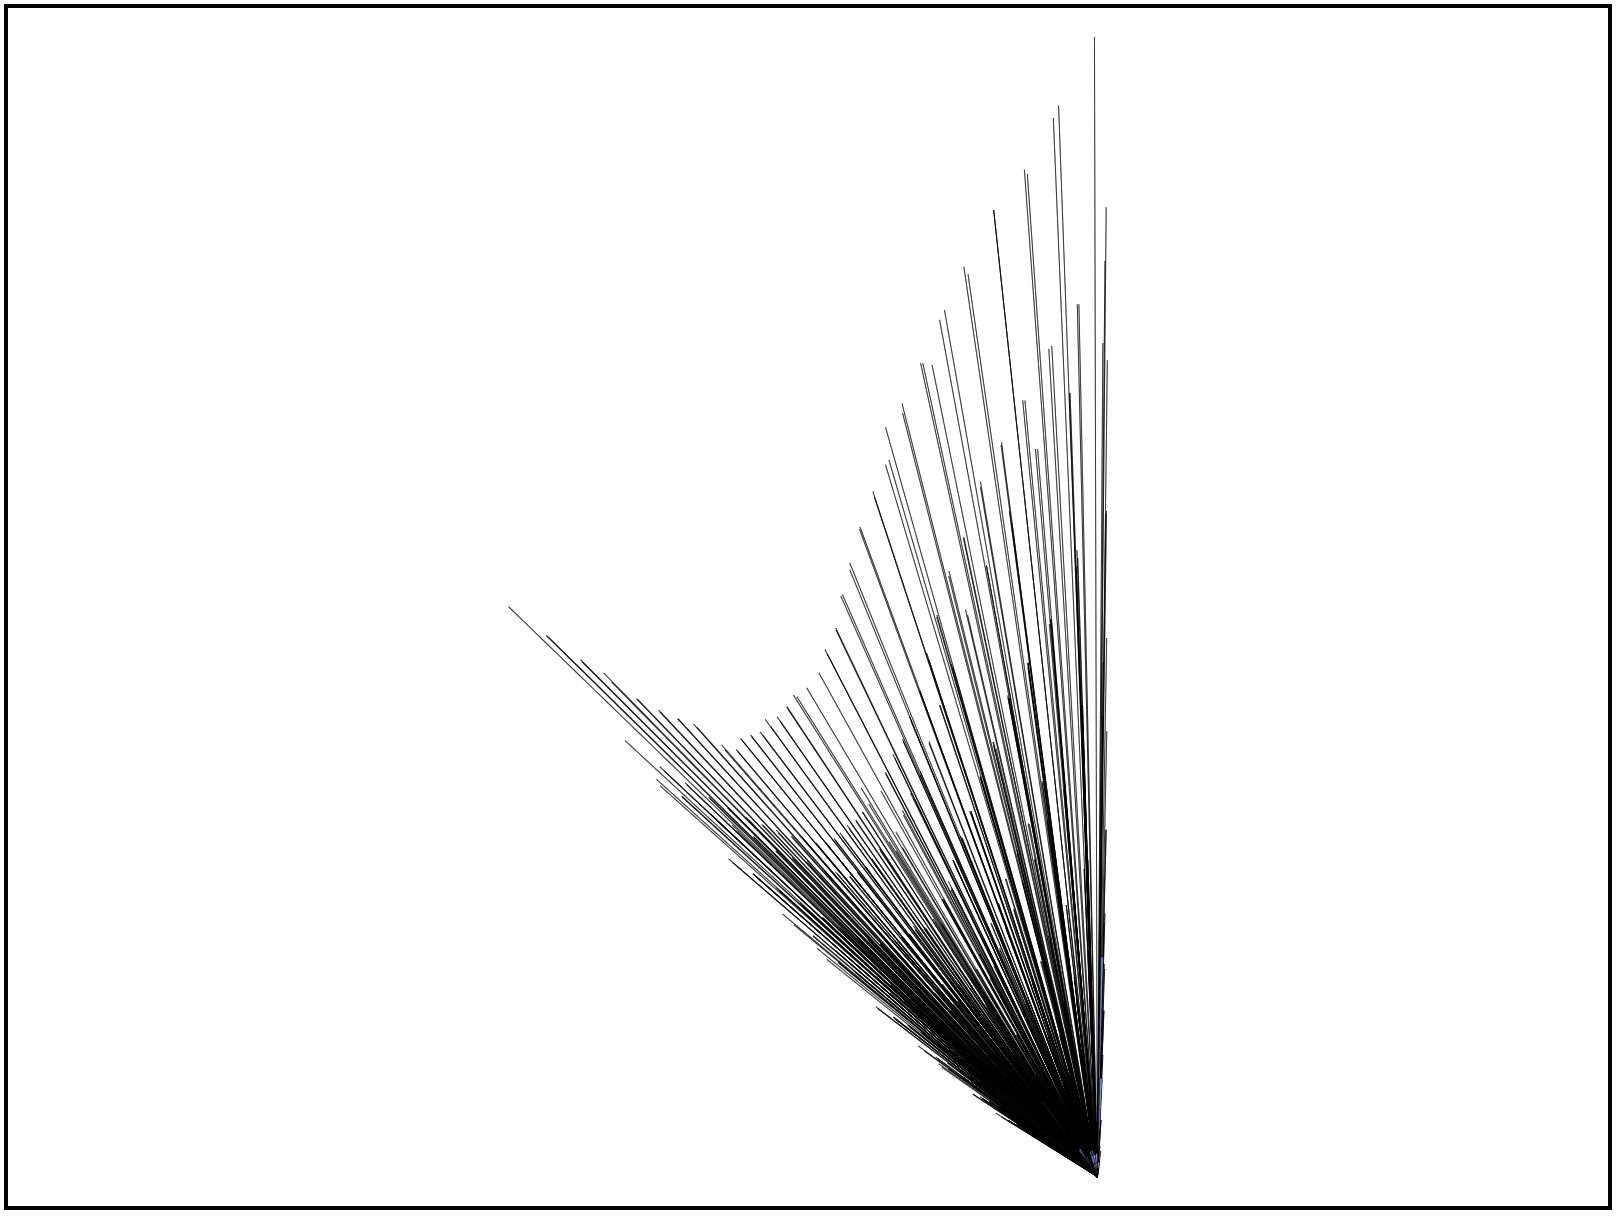
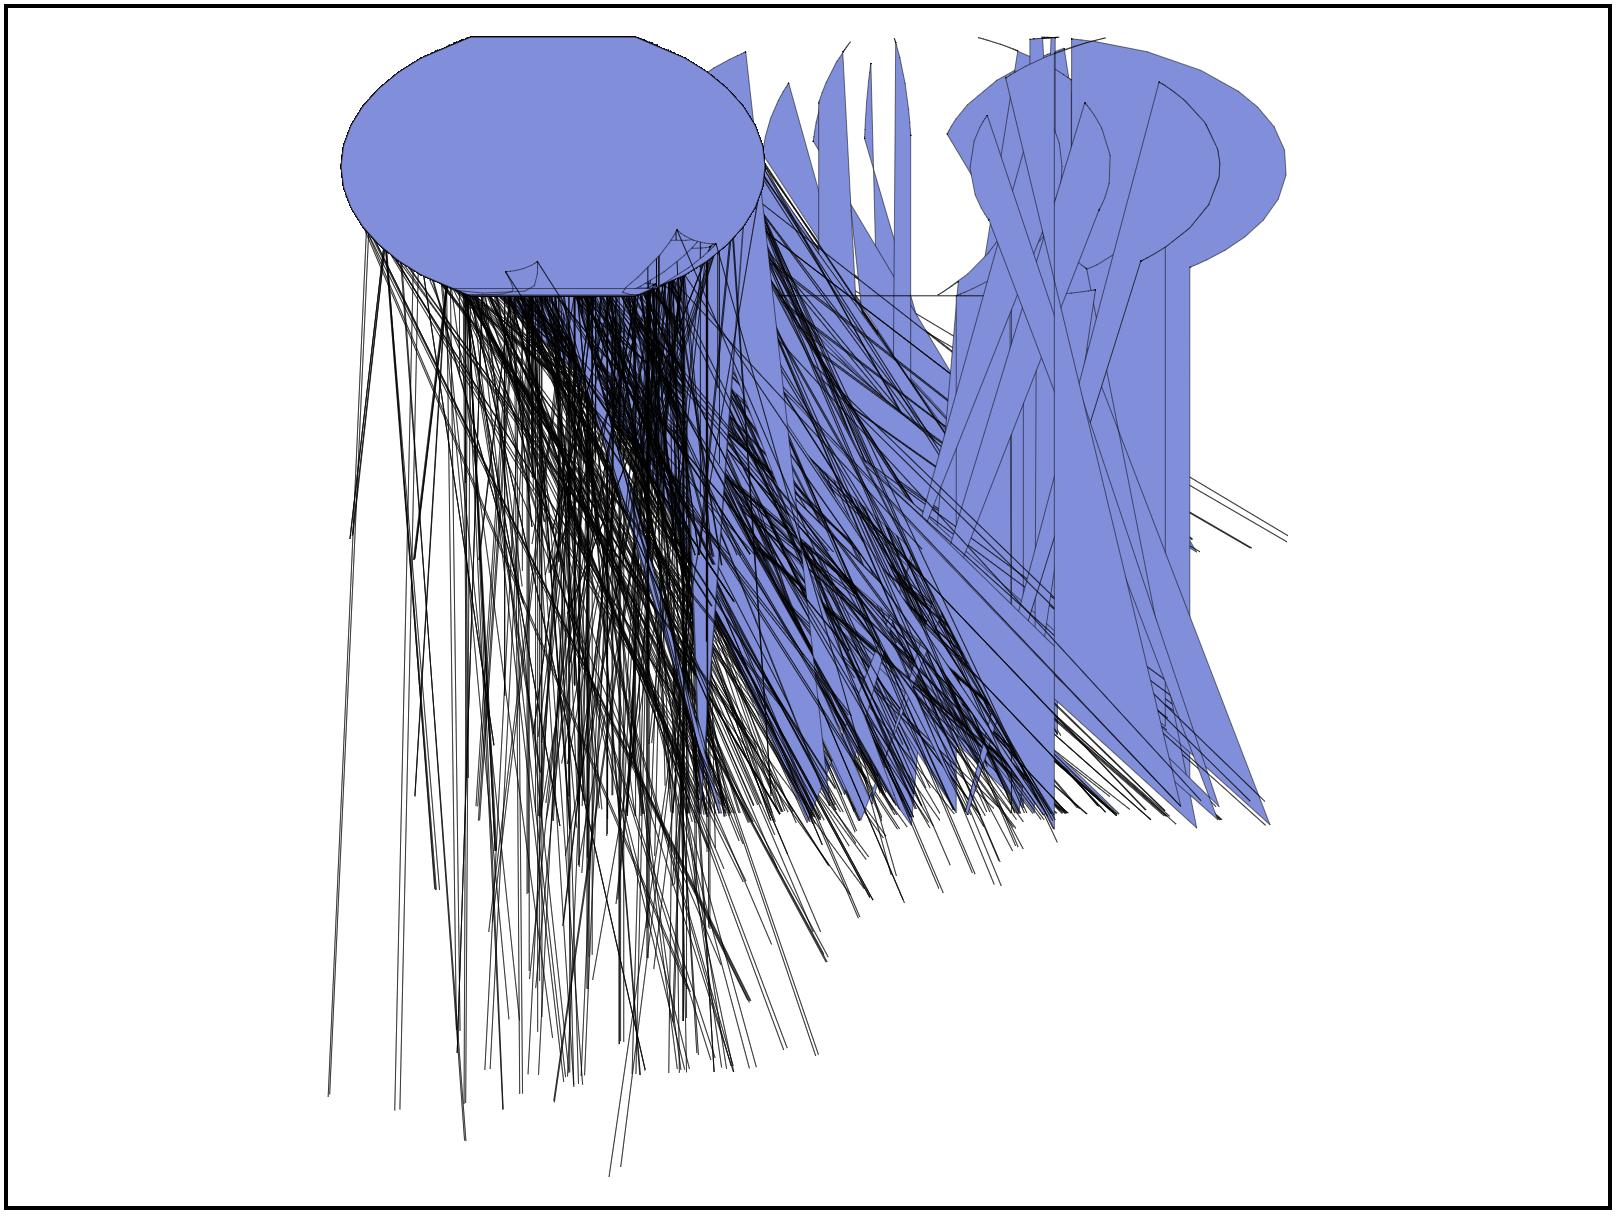
D3 geoProjections take unprojected data points on a three dimensional globe and project them on to a two dimensional plane. Your data is already 2 dimensional (I believe you or someone else had a question on stack overflow regarding this dataset where the projection was discussed, regardless, the pattern shown in your images is indiciative of a projected dataset being projected by d3).
To solve this, you are better off using a geoTransform if you want to apply some sort of transform on the coordinates. But if you only want to scale and translate your data, then a d3.geoIdentity is ideal:
 var projection = d3.geoIdentity()
  .reflectY(true)
  .fitSize([width,height],data);
The suggested code uses reflectY because generally projected data's origin is somewhere down in the bottom left corner of the projection, while svg coordinates have an origin in the top left corner. Y values increase as one moves up the y axis in the typical projected coordinates space, while Y values increase as one moves down the y axis in SVG coordinate space. Therefore, you features may be updside down if you don't reflect on the y.
Second, I've used fitSize to automatically set the translate and scale values of the projection. This method takes an array holding the width and height of a bounding box in svg coordinate space and it also takes a geojson object (not an array - if you have an array, put it in a geojson feature collection). If you want to specify margins, rather than have the feature abut the edge of the specified dimensions, you can use fitExtent.
Now all you have to do is set your geoPath()'s projection to this and you should be able to display the data.
Here's the API documentation on d3.geoIdentity and projection.fitSize.
Alternatively, you can convert/unproject your data so that is "projected" in wgs84, or more accurately, so that it contains longitude/latitude pairs. Then run it through a d3 geoProjection, but if you already have projected data, why unproject it so that you can re-project it when you can use it as is?


