32

I have a GeoPandas DataFrame in EPSG:4326 and I'd make a new DataFrame consisting of all the rows that fall within a certain bounding box.

First I get the bounding box that I care about (which is actually the bounding box of another DataFrame):

print(df_sussex.total_bounds)
[ -1.57239292  50.57467674   0.14528384  51.27465152]

Then I make a DataFrame consisting only of that bounding box:

pts = gpd.GeoDataFrame(df_sussex.total_bounds)

And finally, I try to get all the features that intersect with that bounding box:

sac_sussex = gpd.overlay(pts, df_sac, how='intersection')

But this gives me:

AttributeError: No geometry data set yet (expected in column 'geometry'.

What am I doing wrong?

1
  • 1
    Issue is because you are using 'total_bounds' method. It only produces a tuple with max and min points of bounding box. Method to be used is 'envelope'; previous to build its respective GeoDataFrame.
    – xunilk
    Commented Jan 3, 2018 at 0:26

4 Answers 4

49

You can use the cx method on a geodataframe to select rows within a bounding box. For your example frames:

xmin, ymin, xmax, ymax = df_sussex.total_bounds
sac_sussex = df_sac.cx[xmin:xmax, ymin:ymax]

From http://geopandas.org/indexing.html:

In addition to the standard pandas methods, GeoPandas also provides coordinate based indexing with the cx indexer, which slices using a bounding box. Geometries in the GeoSeries or GeoDataFrame that intersect the bounding box will be returned.

2
  • This solution worked for me. Thank you. However, I was wondering if there's a faster way to implement. Filtering OSM land-use and places that fall within a province's bounding box.
    – EFL
    Commented Sep 15, 2019 at 14:54
  • 5
    Note that .cx does something slightly different than the gpd.overlay solution: it selects rows that intersect the bounding box but leaves the geometries intact, whereas the gpd.overlay solution will only return the parts of the geometries in the bounding box. Depending on the situation you may want one or the other.
    – danvk
    Commented Feb 26, 2020 at 18:55
11

Issue is because you are using 'total_bounds' method. It only produces a tuple with max and min points of bounding box. Method to be used is 'envelope'; previous to build its respective 'GeoDataFrame'. For instance, reading my shapefiles as GeoDataFrame:

import geopandas as gpd
pol1 = gpd.GeoDataFrame.from_file("pyqgis_data/polygon1.shp")
pol8 = gpd.GeoDataFrame.from_file("pyqgis_data/polygon8.shp")

Building bounding box of pol1 and creating its respective GeoDataFrame:

bounding_box = pol1.envelope
df = gpd.GeoDataFrame(gpd.GeoSeries(bounding_box), columns=['geometry'])

Intersecting both GeoDataFrame:

intersections = gpd.overlay(df, pol8, how='intersection')

Plotting results:

from matplotlib import pyplot as plt
plt.ion()
intersections.plot() 
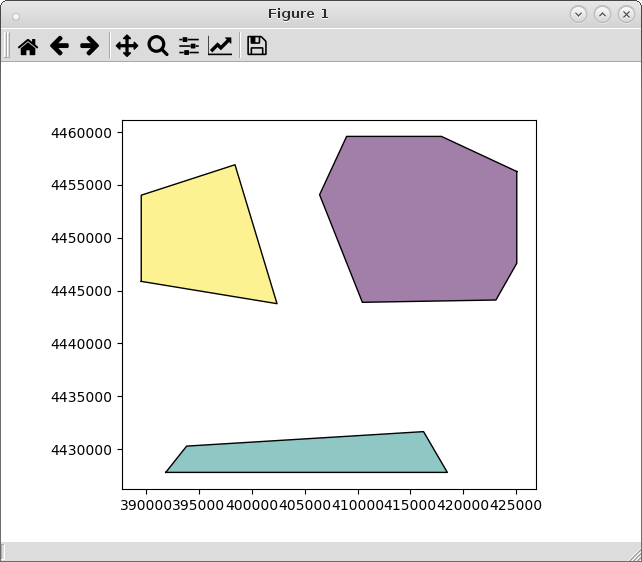
enter image description here

It worked as expected.

Editing Note:

By using 'total_bounds' method (because 'envelope' method returns the bounding box for each feature of polygons), it can be used this approach:

from matplotlib import pyplot as plt
import geopandas as gpd
from shapely.geometry import Point, Polygon

pol1 = gpd.GeoDataFrame.from_file("pyqgis_data/polygon1.shp")
pol8 = gpd.GeoDataFrame.from_file("pyqgis_data/polygon8.shp")

bbox = pol1.total_bounds

p1 = Point(bbox[0], bbox[3])
p2 = Point(bbox[2], bbox[3])
p3 = Point(bbox[2], bbox[1])
p4 = Point(bbox[0], bbox[1])

np1 = (p1.coords.xy[0][0], p1.coords.xy[1][0])
np2 = (p2.coords.xy[0][0], p2.coords.xy[1][0])
np3 = (p3.coords.xy[0][0], p3.coords.xy[1][0])
np4 = (p4.coords.xy[0][0], p4.coords.xy[1][0])

bb_polygon = Polygon([np1, np2, np3, np4])

df2 = gpd.GeoDataFrame(gpd.GeoSeries(bb_polygon), columns=['geometry'])

intersections2 = gpd.overlay(df2, pol8, how='intersection')

plt.ion()
intersections2.plot()

and result is identical.

2

A quick solution to this if the shape you want to clip by is a box:

from shapely.geometry import box

bbox = box(*df_sussex.total_bounds)
df_clipped = gpd.mask(df, mask=bbox)

It uses the shapely.geometry.box() function.

1
  • 1
    gpd.mask() isn't a GeoPandas function, perhaps this should read df_clipped = gpd.clip(df, mask=bbox) ?
    – neirbom9
    Commented Jan 7, 2023 at 3:06
0

Another option if you want to use a buffer on the bounding box.

def filter_by_overlay_and_bounding_box(from_shape, filter, buffer_dist=0):
"""
Given a input shape (from_shape), a filter gdb and a buffer dist, this function returns
geometry from 'from_shape' which lies within the bounds on the filter shape + buffer
Args:
    from_shape (): 
    filter ():
    buffer_dist ():

Returns:

"""
    import shapely
    bound = shapely.geometry.box(*filter.total_bounds).buffer(buffer_dist)
    bound = gpd.GeoDataFrame(gpd.GeoSeries(bound), columns=['geometry'])
    bound = bound.set_crs(from_shape.crs)
    return gpd.overlay(from_shape, bound, how='intersection')

Your Answer

By clicking “Post Your Answer”, you agree to our terms of service and acknowledge you have read our privacy policy.

Not the answer you're looking for? Browse other questions tagged or ask your own question.