8

Given a line and a set of points, I can't figure out how to use sf to identify which side of the line each point falls.

A small reproducible example follows, adapted from a different question

# Load Libraries ----------------------------------------------------------

library('sf')

# Test data ---------------------------------------------------------------

points.df <- data.frame(
    'x' = c(-53.50000, -54.15489, -54.48560, -52.00000, -52.57810, -49.22097, -48.00000),
    'y' = c(-38.54859, -41.00000, -38.80000, -38.49485, -38.00000, -40.50000, -37.74859)
)


line.df <- data.frame(
    'x' = c(-54.53557, -52.00000, -50.00000, -48.00000, -46.40190),
    'y' = c(-39.00000, -38.60742, -38.08149, -38.82503, -37.00000)
)

# Create 'sf' objects -----------------------------------------------------

points.sf <- st_as_sf(points.df, coords = c("x", "y"))

st_crs(points.sf) <- st_crs(4326) # assign crs

line.sf <- st_sf(id = 'L1', st_sfc(st_linestring(as.matrix(line.df), dim = "XY")))
st_crs(line.sf) <- st_crs(4326) # assign crs


# Plots -------------------------------------------------------------------

xmin <- min(st_bbox(points.sf)[1], st_bbox(line.sf)[1])
ymin <- min(st_bbox(points.sf)[2], st_bbox(line.sf)[2])
xmax <- max(st_bbox(points.sf)[3], st_bbox(line.sf)[3])
ymax <- max(st_bbox(points.sf)[4], st_bbox(line.sf)[4])

plot(points.sf, pch = 19, xlab = "Longitude", ylab = "Latitude",
     xlim = c(xmin,xmax), ylim = c(ymin,ymax), graticule = st_crs(4326), axes = TRUE)

plot(line.sf, col = "#C72259", add = TRUE)
text(st_coordinates(points.sf), as.character(1:7), pos = 3)

plot output

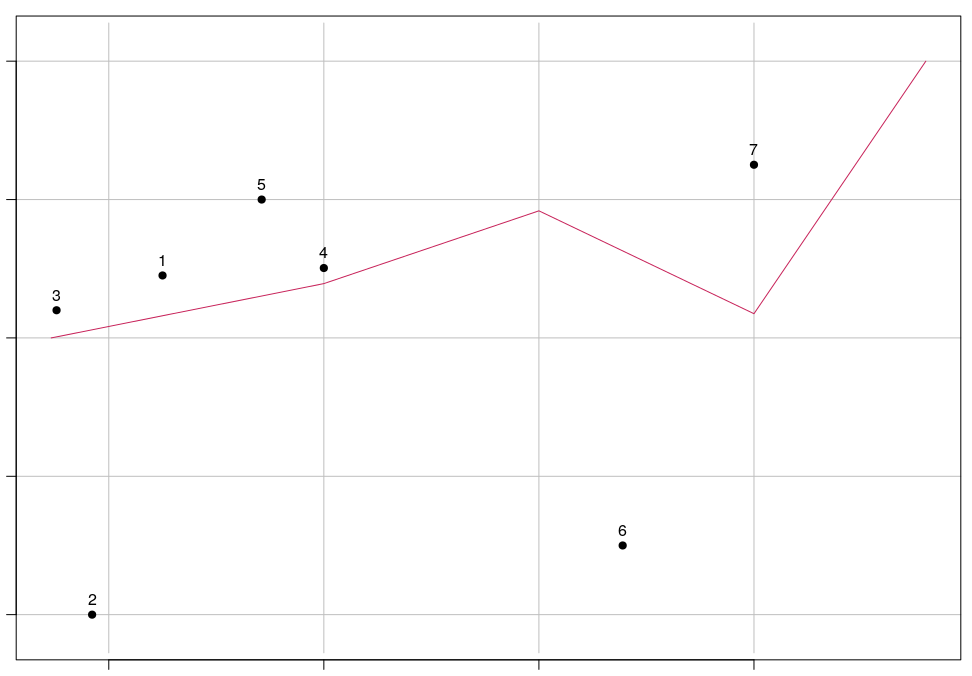
In this example, it's easy to verify that points 2 and 6 fall south of the line, and the rest north. How can I automate the labeling?

Non sf based answers are welcome too.

2 Answers 2

9

The answer provided is related to this question How to subset a SpatialPoints object to get the points located on each side of a SpatialLines object using R? but using sf library instead of sp.

Check the commented code below.

# Load Libraries ----------------------------------------------------------

library('sf')

# Test data ---------------------------------------------------------------

points.df <- data.frame(
  'x' = c(-53.50000, -54.15489, -54.48560, -52.00000, -52.57810, -49.22097, -48.00000),
  'y' = c(-38.54859, -41.00000, -38.80000, -38.49485, -38.00000, -40.50000, -37.74859),
  'id' = as.character(c(1:7))
)


line.df <- data.frame(
  'x' = c(-54.53557, -52.00000, -50.00000, -48.00000, -46.40190),
  'y' = c(-39.00000, -38.60742, -38.08149, -38.82503, -37.00000)
)

# Create 'sf' objects -----------------------------------------------------

points.sf <- st_as_sf(points.df, coords = c("x", "y"))

st_crs(points.sf) <- st_crs(4326) # assign crs

line.sf <- st_sf(id = 'L1', st_sfc(st_linestring(as.matrix(line.df), dim = "XY")))
st_crs(line.sf) <- st_crs(4326) # assign crs    

# Plots -------------------------------------------------------------------

xmin <- min(st_bbox(points.sf)[1], st_bbox(line.sf)[1])
ymin <- min(st_bbox(points.sf)[2], st_bbox(line.sf)[2])
xmax <- max(st_bbox(points.sf)[3], st_bbox(line.sf)[3])
ymax <- max(st_bbox(points.sf)[4], st_bbox(line.sf)[4])

plot(points.sf, pch = 19, xlab = "Longitude", ylab = "Latitude",
     xlim = c(xmin,xmax), ylim = c(ymin,ymax), graticule = st_crs(4326), axes = TRUE)

plot(line.sf, col = "#272822", lwd = 2, add = TRUE)
text(st_coordinates(points.sf), as.character(points.sf$id), pos = 3)
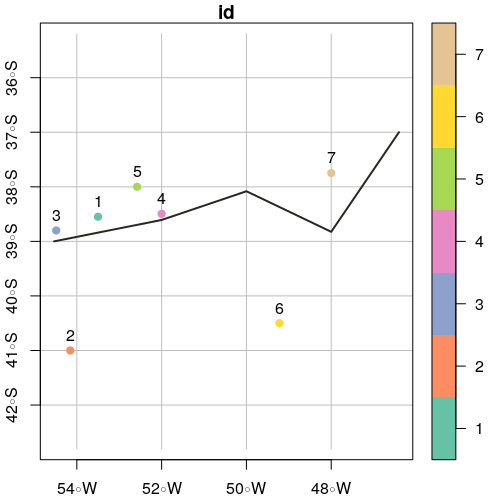
map1

# Create Polygons from line -----------------------------------------------

# Add x and y offsets (in degrees units)
offsetX <- 0
offsetY <- 3

polySideUp <- rbind(c(st_bbox(line.sf)['xmax'] + offsetX, 
                       st_bbox(line.sf)['ymax'] + offsetY),
                     c(st_bbox(line.sf)['xmin'] - offsetX, 
                       st_bbox(line.sf)['ymax'] + offsetY),
                     as.data.frame(st_coordinates(line.sf))[,c(1,2)],
                     c(st_bbox(line.sf)['xmax'] + offsetX, 
                       st_bbox(line.sf)['ymax'] + offsetY))

polySideDown <- rbind(c(st_bbox(line.sf)['xmax'] + offsetX, 
                       st_bbox(line.sf)['ymin'] - offsetY),
                     c(st_bbox(line.sf)['xmin'] - offsetX, 
                       st_bbox(line.sf)['ymin'] - offsetY),
                     as.data.frame(st_coordinates(line.sf))[,c(1,2)],
                     c(st_bbox(line.sf)['xmax'] + offsetX, 
                       st_bbox(line.sf)['ymin'] - offsetY))

# Create sf objects
polySideUp <- st_sf("id" = 'sideUp', st_sfc(st_polygon(list(as.matrix(polySideUp))), crs = 4326))
polySideDown <- st_sf("id" = 'sideDown', st_sfc(st_polygon(list(as.matrix(polySideDown))), crs = 4326))

# Plot
plot(polySideUp, xlab = "Longitude", ylab = "Latitude", col = "#C72259", 
     xlim = c(xmin - offsetX, xmax + offsetX), ylim = c(ymin - offsetY, ymax + offsetY), graticule = st_crs(4326), axes = TRUE)
plot(polySideDown, col = "#53A8BD", add = TRUE)
plot(points.sf$geometry, pch = 19, add = TRUE)
plot(line.sf, col = "#272822", lwd = 2, add = TRUE)
text(st_coordinates(points.sf), as.character(points.sf$id), pos = 3)
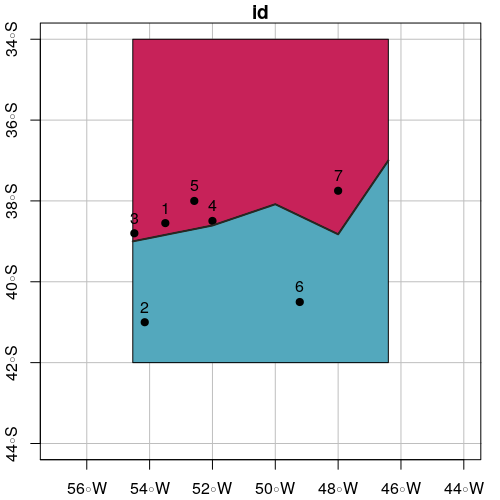
map2

# Select points in side up
pointsInSideUp <- st_intersection(points.sf, polySideUp)

print(pointsInSideUp)
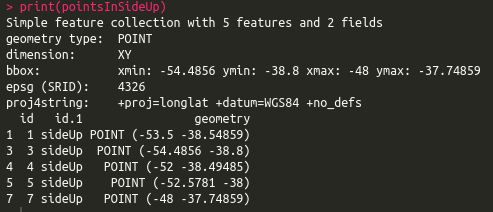
print1

# Select points in side down
pointsInSideDown <- st_intersection(points.sf, polySideDown)

print(pointsInSideDown)

print2

# Plot intersection
plot(polySideUp, xlab = "Longitude", ylab = "Latitude", col = "#C72259", 
     xlim = c(xmin - offsetX, xmax + offsetX), ylim = c(ymin - offsetY, ymax + offsetY), graticule = st_crs(4326), axes = TRUE)
plot(polySideDown, col = "#53A8BD", add = TRUE)
plot(pointsInSideUp, pch = 19, col = "#53A8BD", add = TRUE)
plot(pointsInSideDown, pch = 19, col = "#C72259", add = TRUE)
plot(line.sf, lwd = 2, col = "#272822", add = TRUE)
text(st_coordinates(points.sf), as.character(points.sf$id), pos = 3)
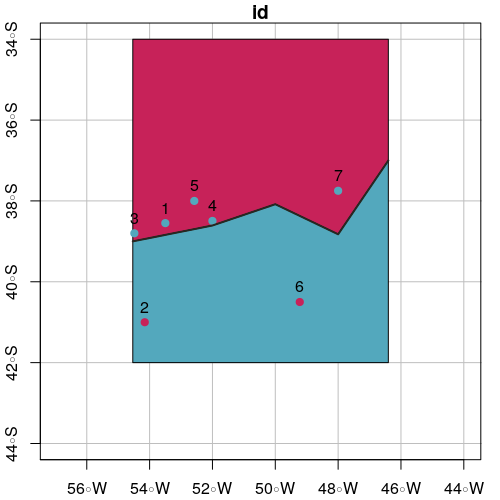
map3

4
  • 1
    Transforming to a different CRS might not be the right thing to do - its possible the questioner would rather have "north" and "south" refer to latitude. I don't know why you chose that particular one because its a bit rotated compared to lat-long at that point. I'd stick with lat-long or a mercator. I'll delete my answer because this is a nice implementation of my outline.
    – Spacedman
    Commented Jan 13, 2018 at 8:31
  • Hi @Spacedman! Do you mean transforming to crs 32721? You are right that is not necessary. It's UTM zone 21 South; I think that the points fall in that zone but I'm not sure. I will modify my answer using crs 4326. Thanks!
    – Guz
    Commented Jan 13, 2018 at 8:43
  • The OP asked above/below in the context of 32721, if that's not what was intended then the Q should be updated, not this answer to the current Q. (The Q includes above/below and north/south so it's strictly ambiguous atm).
    – mdsumner
    Commented Jan 13, 2018 at 8:46
  • 1
    CRS 32721 in my original Q got there simply because it was used in the code snippet that I re-purposed... my bad! I've updated my question to get rid of the potentially confusing transformation from 4326 to 3721.
    – HAVB
    Commented Jan 13, 2018 at 15:47
7

Outline algorithm, which also gives a stronger definition of "north or south" of the line:

Turn the line into a polygon by adding two extra line segments from the end points down to Y=-Infinity, or at least further south than the southernmost point. Then do a point-in-polygon test. Points in the polygon are south of the line.

Repeat to create a polygon with infinity (or large) positive extra segments. That gives you points north of the line.

Points in neither polygon are undefined as to their north-south of the line nature - they are east or west of the line.

Your Answer

By clicking “Post Your Answer”, you agree to our terms of service and acknowledge you have read our privacy policy.

Not the answer you're looking for? Browse other questions tagged or ask your own question.