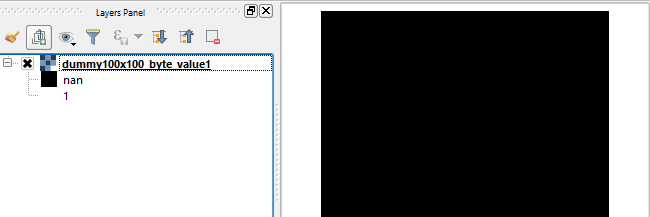
I want to print the minimum and maximum pixel values of a raster.
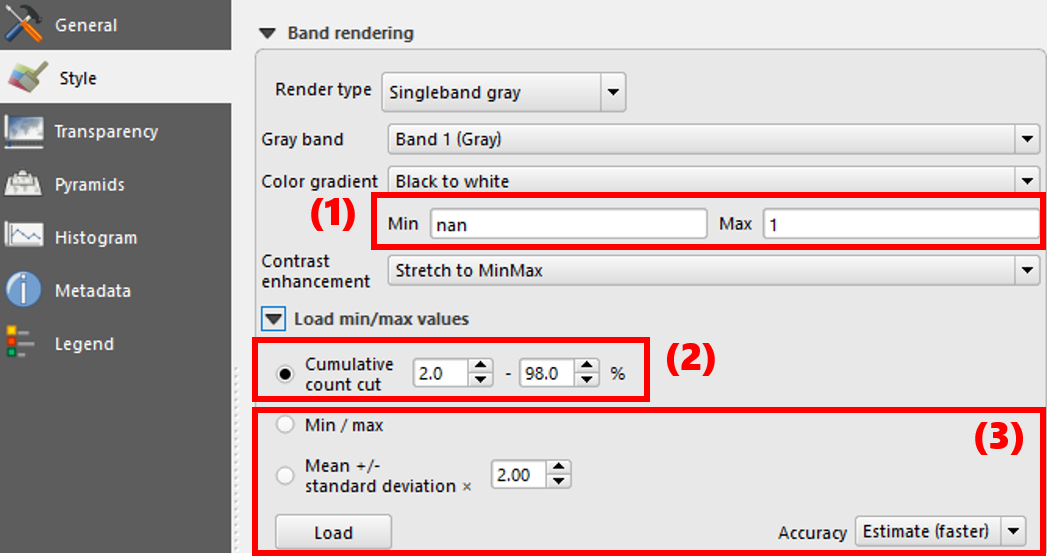
When I load the raster Pioneertown.row1.asc in Layers Panel in QGIS, it is showing minimum value = 'nan' and maximum value = '1' .
ds = gdal.Open("E:/Sreeraj/Task Global Data CONVERSION/Split/output/Pioneertown_Agriculture/Pioneertown_row1.asc")
stats =   ds.GetRasterBand(1).GetStatistics(0,1)
print stats
[1.0, 1.0, 1.0, 0.0]
According to this Python program in Python Console in QGIS, I am getting minimum value = '1.0', maximum value = '1.0', mean value = '1.0' and standard deviation = '0.0'.
But, I want to get minimum value = 'nan' or '0.0' or '-999' (no data value).
For that, what should I do ?


