7

The lidR package in R provides a way to mark individual points in a point cloud with a flightline ID by using lasflightline(). From the documentation:

Retrieve each individual flightline by attributing a number to each point. The function depends on the GPS time to retrieve each individual flightline. In a continuous dataset, once points are ordered by GPS time, the time between two consecutive points does not exceed a few milliseconds. If the time between two consecutive points is too long it means that the second point is from a different flightline. The default threshold is 30 seconds. A column 'flightlineID' is added in the slot @data

How can one filter the resulting point cloud by the flightline ID so that overlapping points from different flightlines are removed from the filtered product? Essentially, I am looking to remove the overlapping points so as to produce a homogeneous point cloud with no scanline overlaps.

0

3 Answers 3

5

This is not natively possible yet in lidR! But R is a programming language so you can write your own algorithm to achieve this task. If you can do that please share with the community it could be useful ;-). I think LAStools has such tool.

0
5

Update:

Essentially, I am looking to remove the overlapping points so as to produce a homogeneous point cloud with no scanline overlaps.

Besides thinning (Thinning large LiDAR point cloud?), if the .las file is classified (or flagged) as 'overlapping' points one can filter those out on-the-fly while importing data in R.

  • For versions LAS 1.0 to 1.3 (point formats 0 to 5) overlapping points have their own class code, usually class 12. They can be filtered out with -drop_class 12 as reported in your answer here.

  • For version LAS 1.4 (point formats 6 to 10), it was introduced a group of classification flags, being one of them Overlap. This flag allows points to be flagged 'overlap' while also labeled with a different class code. For example, it can be an overlapping point (flagged) and a ground point (class 2). For those types of files, do the following*:

library(lidR) 
file.path <- system.file("extdata", "Megaplot.laz", package="lidR")
lidar <- readLAS(file.path, filter = "-drop_overlap") #LAS 1.4 (point formats 6 to 10) which has overlapping points set to 1 in the Classification Flag 'Overlap'.

Other methods and software for removing overlapping points are reported in Open source approach to classifying and removing LiDAR points from overlapping scans?


Original answer:

How to filter point cloud by flightline in R?

As pointed by JRR's answer, it is not possible yet using native filters from readLAS function available in the lidR package (see rlas:::lasfilterusage()).

So, the current alternative is to use lasfilter. See below:

library(lidR) 
file.path <- system.file("extdata", "Megaplot.laz", package="lidR")
lidar <- readLAS(file.path)
lasflightline(lidar, dt = 30)
#check how many flight lines (there should be at least two, so this exercise makes sense)
unique(lidar@data$flightlineID)

for (i in c(1:2)){
assign(paste("lidar.flightline.",i,sep=""), lasfilter(lidar, flightlineID == i))
}

rm(file.path,i,lidar)
0
0

As my ALSdataset is not classified containing overlapping points, I thought a way of using @AndreSilva flightline filtering. I created a function with the package [lidR][1](2.2.2) that what it does is to divide the las file into chunks, checks if the points in that chunk come from more than one flightline and if so, filters the point so the most represented flightline remains. It needs a quite small chunk sizes for good results which makes it very slow but maybe there is someone out there that can think in how to make it quicker.

library(lidR)
library(future)
plan(multisession, workers = 12L)
set_lidr_threads(12L)

path = "path to folder with data"
ctg <- readLAScatalog(path)

cuts = c(0,3,6,9,12,15,30)

dens0<-grid_density(ctg_1, res = 5)                       #Calculate for checking
plot(dens0,breaks=cuts,col=rainbow(12))

opt_chunk_size(ctg_1) <- 20                               # Needs to be small for precission
opt_chunk_buffer(ctg_1) <- 0                              
opt_output_files(ctg_1) <- paste0(tempfile(), "_{ID}")

myfun = function(cluster)
{
  las = readLAS(cluster)
  if (is.empty(las)) return(NULL)

  if (length((unique(las$PointSourceID)))>1){             # If there are more than 1 flightline in a chunk:

    table <- table(las@data$PointSourceID)#---------------#
    table <- sort(table , decreasing=T)                   #
    table <- as.data.frame(table)                         # Obtain as an INTEGER the
    table$Var1 <- as.character(table$Var1)                # most represented flightline in a chunk
    table$Var1 <- as.numeric(table$Var1)                  #
    most <- table$Var1[1]#--------------------------------#

    las <- lasfilter(las, PointSourceID == most)          # Only remains most represented flightline 
    return(las)
  }  else {return(las)}                                   # If there is only 1 flightline in a chunk

}

output <-catalog_sapply(ctg_1, myfun)                     # Apply function to catalog

dens1<-grid_density(output, res = 5)                      # Calculate for checking
plot(dens1,breaks=cuts,col=rainbow(12))

The result is a catalog containing all the chunks which makes extremely slow further processing. The fastest way to solve this is to read the ctg as a lasfile (readLAS(ctg)) butis not suggested as the output can be unmanageable.
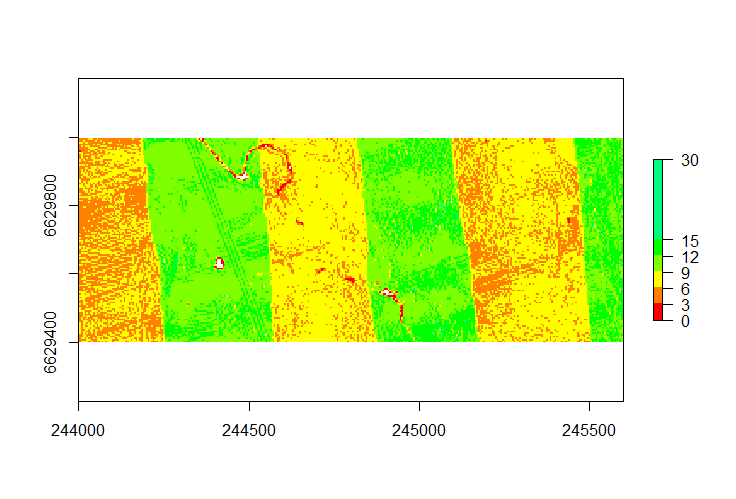
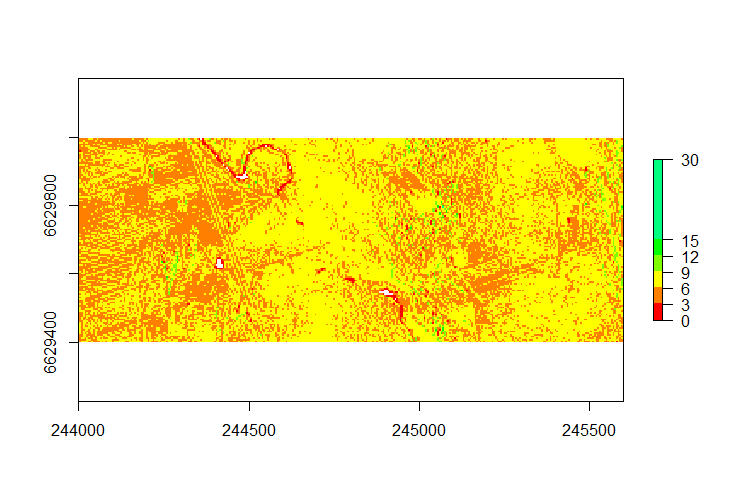
Catalog grid density with overlapping of flightlines Catalog grid density after applying function

----------------------------EDIT---------------------------

Following the suggested approach of @JRR I made this code. The results are not as good as with the previous code (flightlines's boundaries are still noticeable) but it takes much less time.

opt_chunk_size(ctg) <- 250
opt_chunk_buffer(ctg) <- 0
opt_output_files(ctg) <- paste0(tempfile(), "_{ID}")

myfun.LAS = function(las)
{
  PSID <- grid_metrics(las, ~quantile(PointSourceID, probs = 0.99), 1)  #obtain most represented flighline in segments of 1m^2
  las <- lasmergespatial(las, PSID, "PSID")       #Add a new attribute to each point of the most represented PSID in the 1m^2 segment where it is
  las <- lasfilter(las, PointSourceID == PSID)    #filter cloud       
  las$PSID <- NULL

  return(las)
}

myfun.ctg = function(cluster)
{
  las = readLAS(cluster)
  if (is.empty(las)) return(NULL)

  las <- myfun.LAS(las)                        
  return(las)                                  
}

output <- catalog_apply(ctg, myfun.ctg)
output <- readLAScatalog(unlist(output))
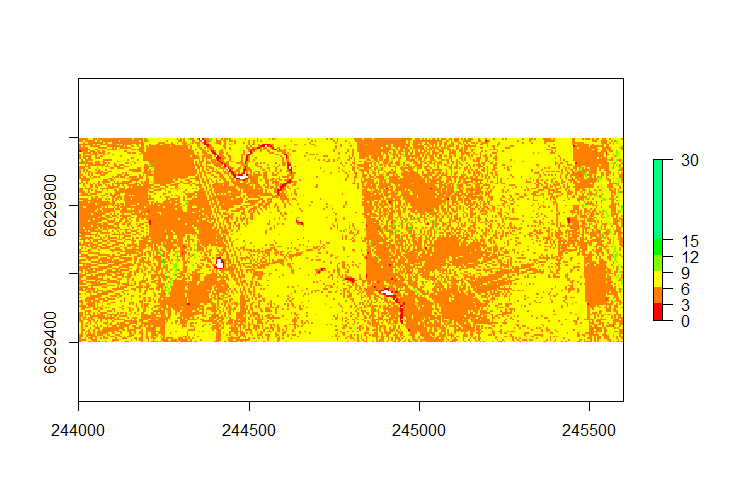
Result of the new function

5
  • 1
    opt_chunk_size tells you that a chunk size above 250 is likely to be a bad idea and it is true. On overall your idea is not bad but you should use grid_metrics to get the most represented flightline then lasmergespatial + lasfilter to remove the overlaping flightlines. Then you will be able to process meaningfull chunks or tiles.
    – JRR
    Commented Feb 21, 2020 at 17:29
  • 1
    I downvoted until you change this example for something more "workable". With a better implementation it may be a good anwser
    – JRR
    Commented Feb 21, 2020 at 17:33
  • I think I understood your approach. Similar to this vignette if I am not wrong. I have applied this method but the result are not as good. You can check the "EDIT" part of my answer for the code Commented Feb 24, 2020 at 7:48
  • Your original option was "find the most represented point source ID in 20 x 20 pixel". You second option is "find the most represented PSI in 1 x 1 pixel with a quantile approach". The first attempt was a good idea, the second a correct implmentation. Try something like gist.github.com/Jean-Romain/40b4658c581a1b701c62d3f0bb4288dd
    – JRR
    Commented Feb 24, 2020 at 9:40
  • Thanks for your suggestion. I haven't created any metric yet for using it in grid_metrics so I just copied the vignette. I reduced the size of the segments because I found that when created a raster it did not work as good as when it looked within chunks of 20x20 Commented Feb 25, 2020 at 8:42

Your Answer

By clicking “Post Your Answer”, you agree to our terms of service and acknowledge you have read our privacy policy.

Not the answer you're looking for? Browse other questions tagged or ask your own question.