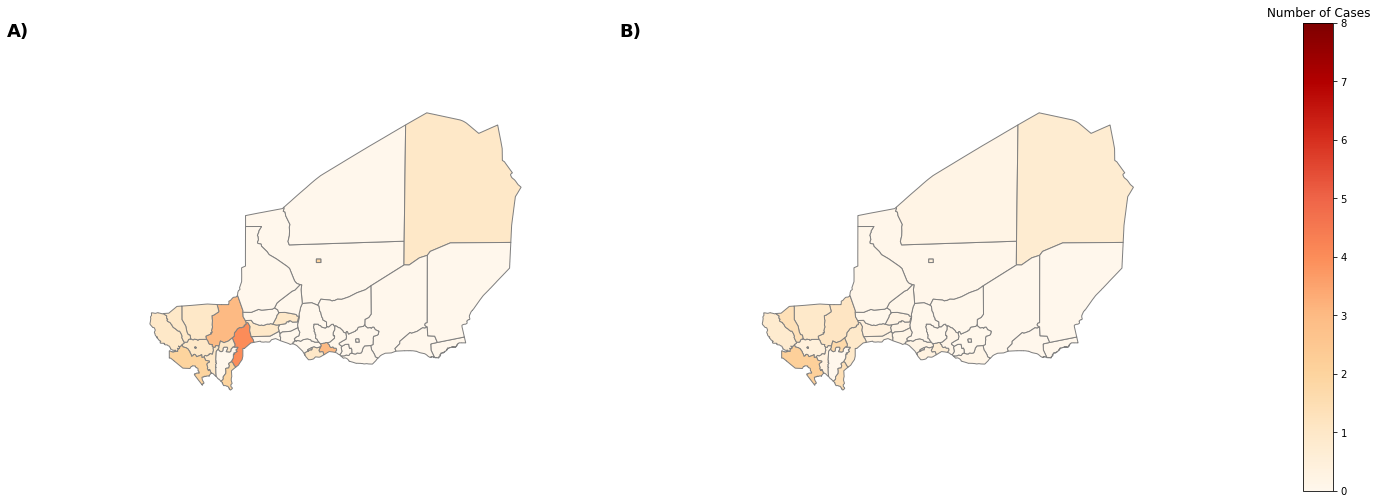
I use geopandas and matplotlib.pyplot's subplots to plot two subplots in a single figure, with a single colorbar, as:
How do I reduce the whitespace around the maps in each subplot (not in between subplots - I know how to do that)?
The relevant code is:
import geopandas as gpd
import matplotlib.pyplot as plt

side_length = 10
test_data = gpd.read_file(shpfile)
fig, axes = plt.subplots(1, 2, figsize=(side_length * 2.1, side_length))
fig.subplots_adjust(hspace=0.5, wspace=0.5)

# 1st subplot
test_data['data'] = data1 # assume data is in a list data1
ax = test_data.plot(column='data', axes=axes.flat[0], cmap=cmap, edgecolor='gray', vmin=vmin, vmax=vmax)
ax.set_axis_off()
ax.set_aspect('equal')

# 2nd subplot
test_data['data'] = data1 # assume data is in a list data2
ax = test_data.plot(column='data', axes=axes.flat[1], cmap=cmap, edgecolor='gray', vmin=vmin, vmax=vmax)
ax.set_axis_off()
ax.set_aspect('equal')

# Add single colorbar
cax = fig.add_axes([0.9, 0.17, 0.02, 0.65])
sm = plt.cm.ScalarMappable(cmap=cmap, norm=plt.Normalize(vmin=vmin, vmax=vmax))
sm._A = []
cbar = fig.colorbar(sm, cax=cax)
cbar.ax.set_title('Number of Cases')

fig.savefig('myFig.pdf', bbox_inches='tight', pad_inches=0.1)

