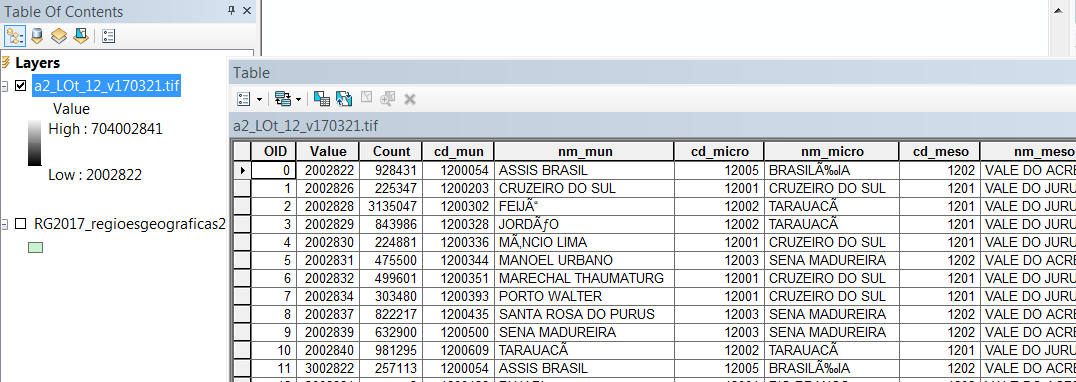
Per the raster documentation, adding 'RAT = TRUE' when reading in the file should solve your problem, so long as the .tif.aux.xml file holds category data. Demo:
library(raster)
options(stringsAsFactors = FALSE)

test <- raster(nrows = 10, ncols = 10)
test[] <- sample(1:10, 100, replace = TRUE)

test_rat <- data.frame('ID' = seq.int(10),
                       'CAT' = c('cat', 'dog', 'banana', 'ship', 'egg',
                                 'tree', 'beer', 'shoe', 'light', 'pen'))

levels(test) <- test_rat

writeRaster(test, 'C:/data/test_rat.tif', datatype = 'INT2S', overwrite = TRUE)

tested <- raster('C:/data/test_rat.tif', RAT = TRUE)

# optional:
rasterVis::levelplot(tested)
The tif.aux.xml generated by writeRaster above looks like:
<PAMDataset>
  <PAMRasterBand band="1">
    <CategoryNames>
      <Category></Category>
      <Category>cat</Category>
      <Category>dog</Category>
      <Category>banana</Category>
      <Category>ship</Category>
      <Category>egg</Category>
      <Category>tree</Category>
      <Category>beer</Category>
      <Category>shoe</Category>
      <Category>light</Category>
      <Category>pen</Category>
    </CategoryNames>
  </PAMRasterBand>
</PAMDataset>
so if your file looks similar you should be fine.
EDIT:
If the attribute data is in a dbf, try something like this:
# read the tif in with RAT = TRUE. Should get an ID column at least in the resulting object.
data_tif <- raster(file.path(getwd(), 'a2_LOt_12_v170321.tif', RAT = TRUE)

# read the dbf in as a data frame
data_dbf <- foreign::read.dbf(file.path(getwd(), 'a2_LOt_12_v170321.tif.vat.dbf'))
Have a look at levels(data_tif)[[1]] and compare with data_dbf. Make sure number of rows matches, and look for columns in common (ID in the RAT may match VALUE in the dbf, for instance). You can then use base::merge or dplyr::left_join to append the dbf data to the RAT.
Note that write support for RATs is minimal - some advice is here: https://stackoverflow.com/questions/23840178/how-to-write-a-raster-with-rat-factors-in-r-raster-package
Thanks to this question for providing some data I could test with.
 However, I am having a tough time opening that table in R. I expected "levels()" to work, but it returns "NULL":
.tif.vat.dbf), you can likely find some way of opening it, but treating it as a natural part of the raster might not be the best process.