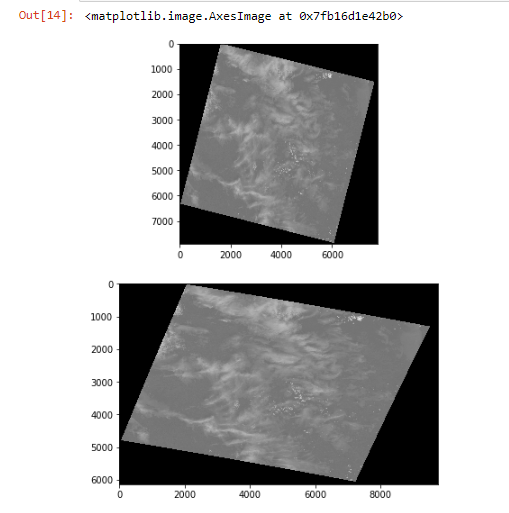
I'm trying to understand some legacy code that processes landsat satellite images. Source images are in UTM and they are reprojected to WGS84. I'm a GIS noob but I understand that WGS84 is a datum for a geographical coordinate system and UTM is a projected coordinate system so what does it mean to reproject from UTM to WGS84? Does it mean to reproject to some standard projection of WGS84? What is that standard?
Please see following code:
# First open raw landsat SR image
source_file = os.path.join(VALHALLA_ROOT, 'test/data/2015_035024/LC08_L1TP_035024_20150626_20170226_01_T1_sr_band1.tif')

with rasterio.open(source_file) as src:
    data1 = src.read()
    print(data1.shape)
    print(src.meta)
(1, 7901, 7801)
{'count': 1, 'driver': 'GTiff', 'height': 7901, 'width': 7801, 'transform': Affine(30.0, 0.0, 518985.0, 0.0, -30.0, 5846715.0), 'dtype': 'int16', 'nodata': -9999.0, 'crs': CRS({'init': 'epsg:32613'})}
# Now reproject to WGS 84
from rasterio.warp import calculate_default_transform, reproject, Resampling

def reproject_tif(source_file, destination_file):
    """Re-projects tif at source file to WGS84 at destination file.

    Args:
        source_file: file to re-project
        destination_file: file to store re-projection

    Returns:
        destination_file: where the re-projected file is saved at
    """

    if os.path.isfile(destination_file):
        logging.info("Projected file already exists, skipping reprojection")
        return

    with rasterio.open(source_file) as src:
        dst_crs = 'EPSG:4326'
        transform, width, height = calculate_default_transform(
            src.crs,
            dst_crs,
            src.width,
            src.height,
            *src.bounds
        )

        kwargs = src.meta.copy()
        kwargs.update({
            'crs': dst_crs,
            'transform': transform,
            'width': width,
            'height': height
        })

        with rasterio.open(destination_file, 'w', **kwargs) as dst:
            for i in range(1, src.count + 1):
                reproject(
                    source=rasterio.band(src, i),
                    destination=rasterio.band(dst, i),
                    src_transform=src.transform,
                    src_crs=src.crs,
                    dst_transform=transform,
                    dst_crs=dst_crs,
                    resampling=Resampling.nearest,
                    num_threads=-1
                )

        return destination_file

dest_file = os.path.join(VALHALLA_ROOT, 'test/data/2015_035024/Reproject_LC08_L1TP_035024_20150626_20170226_01_T1_sr_band1.tif')

with rasterio.open(dest_file) as src:
    data2 = src.read()
    print(data2.shape)
    print(src.meta)
(1, 6140, 9769)
{'count': 1, 'driver': 'GTiff', 'height': 6140, 'width': 9769, 'transform': Affine(0.00035596559131628866, 0.0, -104.73152062773751, 0.0, -0.00035596559131628866, 52.7699321953733), 'dtype': 'int16', 'nodata': -9999.0, 'crs': CRS({'init': 'epsg:4326'})}
%matplotlib inline
import matplotlib.pyplot as plt
fig, ax = plt.subplots(2, figsize=(10, 9))
ax[0].imshow(data1[0, :, :], cmap='gray')
ax[1].imshow(data2[0, :, :], cmap='gray')

